Topic 3.13 Notes – Carrying Out a Test for the Difference Between Two Population Proportions
What a Two-Sample z-Test for Proportions Does
This test is for a binary categorical variable, where each person or item is a success or failure, measured in two independent groups.
- and are the true population proportions for group 1 and group 2.
- Example: could be the true proportion of teens at School A who have a driver’s license.
- could be the true proportion at School B.
The sample proportions are
where are successes and are sample sizes.
For this AP Stats test, the null always says no difference:
Possible alternatives are
You compare the observed difference to the null difference of 0. The order matters the whole way through. If you write group 1 minus group 2 in the hypotheses, you must keep that same order in the calculation and conclusion.
The two groups should be independent. A randomized experiment, like the one shown here, is a common setup where that happens.
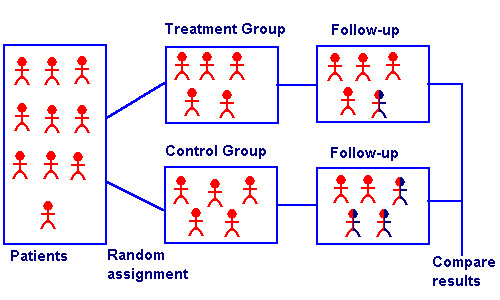
Random assignment to treatment and control groups
This is not for matched pairs or paired data. If the same person is measured twice, or subjects are paired up, this procedure does not fit.
Conditions and Why the Test Pools
Under , the test assumes the two population proportions are equal. That means both samples are estimating one common proportion, so we pool them:
Pooling matters because the test’s standard error is built from the null claim that the proportions are the same.
- It is used only for the hypothesis test standard error
- It is not usually , unless the sample sizes are equal
- It is different from a confidence interval, which uses an unpooled standard error
Conditions for the z-test:
- Randomization
- Two independent random samples, or two groups from a randomized experiment
- Independence
- The groups must be independent
- If sampling without replacement, each sample must satisfy the 10% condition
- Large expected counts
- ,
- ,
A very common mistake is checking counts with and . For this test, use the pooled proportion.
Carrying Out the Test
Here’s the calculation path:
- Find and
- Find
- Compute the null standard error
- Compute the test statistic
- Use the standard normal distribution for the p-value
- Right-tailed:
- Left-tailed:
- Two-sided:
If is positive, then . If is negative, then .
The picture below is a good reminder that the tail comes from the alternative hypothesis, not from whether your sample difference ended up positive or negative.
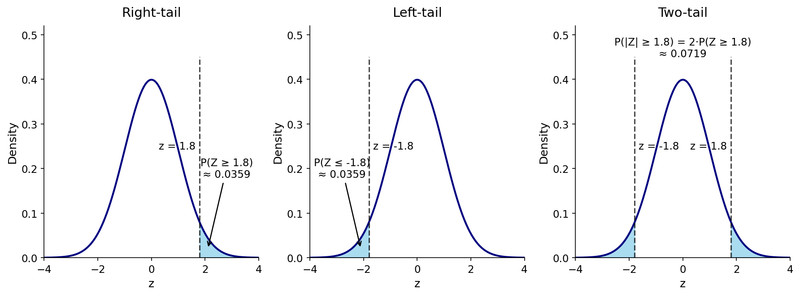
Right-tailed, left-tailed, and two-tailed p-values on a z-curve
Quick example. Suppose group 1 has 48 successes out of 80, and group 2 has 36 out of 90.
Then use in , then in . On technology, this is 2-PropZTest with , plus the correct alternative.
Interpreting the p-Value and Writing the Conclusion
The p-value is the probability, assuming is true, of getting a sample difference or z-statistic at least as extreme as the one observed, in the direction of .
Decision rule:
- If p-value , reject
- If p-value , fail to reject
A strong AP-style conclusion sounds like this:
Because the p-value is less than 0.05, we reject . There is convincing evidence that the true proportion of ___ in group 1 is greater than the true proportion of ___ in group 2.
Keep these out of your answer:
- “accept ”
- “the p-value is the probability that is true”
- “proved”
- causal claims unless it was a randomized experiment
Key Takeaways
Two-Sample Z-Test for a Difference Between Population Proportions
Significance test for whether an observed difference p̂1 − p̂2 provides convincing evidence of a difference between two population proportions
Pooled Proportion (p̂c, Combined Proportion)
Estimate of the common population proportion under H₀: p̂c = (x1 + x2)/(n1 + n2) = (n1p̂1 + n2p̂2)/(n1 + n2)
Null Standard Error for Two Proportions (SE₀)
Standard error used in the test under H₀: SE₀ = √[p̂c(1 − p̂c)(1/n1 + 1/n2)]
Two-Proportion Z Test Statistic
z = (p̂1 − p̂2 − 0)/√[p̂c(1 − p̂c)(1/n1 + 1/n2)]; measures how many null standard errors the observed difference is from 0
Null Hypothesis for a Two-Proportion Test
H₀: p1 = p2, equivalently H₀: p1 − p2 = 0
Alternative Hypotheses for a Two-Proportion Test
Ha can be p1 > p2, p1 < p2, or p1 ≠ p2; choose from the investigative question before seeing the data
Large Expected Counts Condition for a Two-Proportion Z-Test
Using p̂c, all four expected counts must be at least 10: n1p̂c, n1(1 − p̂c), n2p̂c, and n2(1 − p̂c)
P-Value for a Two-Proportion Z-Test
Probability, assuming H₀ is true, of getting a test statistic at least as extreme as the observed z-statistic in the direction of Hₐ
Right-Tailed P-Value for a Two-Proportion Z-Test
For Ha: p1 > p2, p-value = P(Z ≥ zobs)
Left-Tailed P-Value for a Two-Proportion Z-Test
For Ha: p1 < p2, p-value = P(Z ≤ zobs)
Two-Sided P-Value for a Two-Proportion Z-Test
For Ha: p1 ≠ p2, p-value = P(Z ≤ −|zobs|) + P(Z ≥ |zobs|), or twice the one-tail area beyond |zobs|
Decision Rule Using α
If p-value ≤ α, reject H₀; if p-value > α, fail to reject H₀
Conclusion in Context for a Two-Proportion Test
Compare p-value with α, state reject H₀ or fail to reject H₀, and conclude in context in terms of Hₐ about the population proportions using non-definitive language
Order of Groups
Keep group 1 and group 2 in the same order throughout hypotheses, p̂1 − p̂2, z, p-value, and conclusion; reversing order changes the sign
Why Pool in a Two-Proportion Test
Under H₀, p1 = p2, so both samples estimate one common proportion and are pooled to estimate it
Randomization Condition for a Two-Proportion Z-Test
Data come from two independent random samples or from a randomized experiment; the two groups must be independent
10% Condition for a Two-Proportion Z-Test
When sampling without replacement, each sample is no more than 10% of its population: n1 ≤ 0.10N1 and n2 ≤ 0.10N2; not needed for a randomized experiment
Notes
Two-Sample Z-Test for a Difference Between Population Proportions
Significance test for whether an observed difference p̂1 − p̂2 provides convincing evidence of a difference between two population proportions
Pooled Proportion (p̂c, Combined Proportion)
Estimate of the common population proportion under H₀: p̂c = (x1 + x2)/(n1 + n2) = (n1p̂1 + n2p̂2)/(n1 + n2)
Null Standard Error for Two Proportions (SE₀)
Standard error used in the test under H₀: SE₀ = √[p̂c(1 − p̂c)(1/n1 + 1/n2)]
Two-Proportion Z Test Statistic
z = (p̂1 − p̂2 − 0)/√[p̂c(1 − p̂c)(1/n1 + 1/n2)]; measures how many null standard errors the observed difference is from 0
Null Hypothesis for a Two-Proportion Test
H₀: p1 = p2, equivalently H₀: p1 − p2 = 0
Alternative Hypotheses for a Two-Proportion Test
Ha can be p1 > p2, p1 < p2, or p1 ≠ p2; choose from the investigative question before seeing the data
Large Expected Counts Condition for a Two-Proportion Z-Test
Using p̂c, all four expected counts must be at least 10: n1p̂c, n1(1 − p̂c), n2p̂c, and n2(1 − p̂c)
P-Value for a Two-Proportion Z-Test
Probability, assuming H₀ is true, of getting a test statistic at least as extreme as the observed z-statistic in the direction of Hₐ
Right-Tailed P-Value for a Two-Proportion Z-Test
For Ha: p1 > p2, p-value = P(Z ≥ zobs)
Left-Tailed P-Value for a Two-Proportion Z-Test
For Ha: p1 < p2, p-value = P(Z ≤ zobs)
Two-Sided P-Value for a Two-Proportion Z-Test
For Ha: p1 ≠ p2, p-value = P(Z ≤ −|zobs|) + P(Z ≥ |zobs|), or twice the one-tail area beyond |zobs|
Decision Rule Using α
If p-value ≤ α, reject H₀; if p-value > α, fail to reject H₀
Conclusion in Context for a Two-Proportion Test
Compare p-value with α, state reject H₀ or fail to reject H₀, and conclude in context in terms of Hₐ about the population proportions using non-definitive language
Order of Groups
Keep group 1 and group 2 in the same order throughout hypotheses, p̂1 − p̂2, z, p-value, and conclusion; reversing order changes the sign
Why Pool in a Two-Proportion Test
Under H₀, p1 = p2, so both samples estimate one common proportion and are pooled to estimate it
Randomization Condition for a Two-Proportion Z-Test
Data come from two independent random samples or from a randomized experiment; the two groups must be independent
10% Condition for a Two-Proportion Z-Test
When sampling without replacement, each sample is no more than 10% of its population: n1 ≤ 0.10N1 and n2 ≤ 0.10N2; not needed for a randomized experiment
