Topic 3.11 Notes – Justifying a Claim Based on a Confidence Interval for the Difference Between Two Population Proportions
What a Confidence Interval for Means
Here, the parameter is , the true difference between two population proportions. You already built this interval in the previous topic. Now the job is to read it correctly and use it as evidence.
A confidence interval gives a range of plausible values for the true difference. The most important value to check is 0 because means the two population proportions are equal.
That leads to three quick cases on a number line.
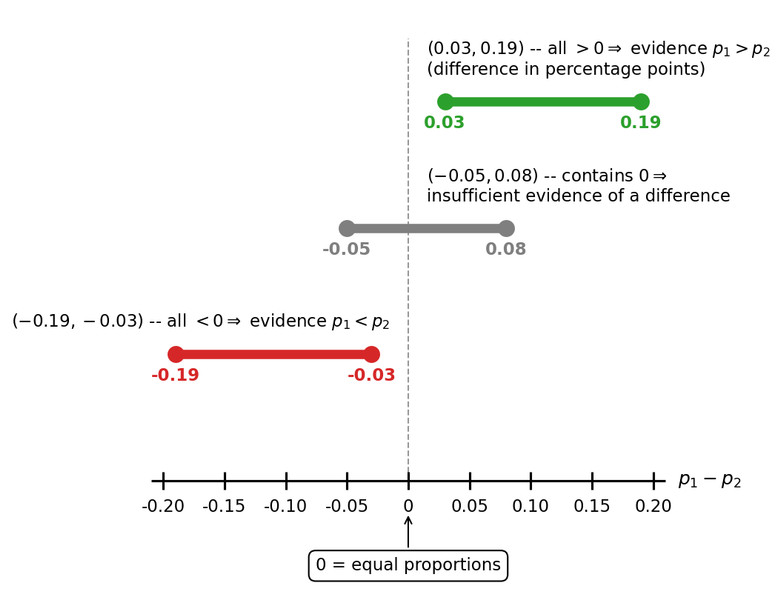
Confidence intervals for
Intervals entirely above 0 support , intervals entirely below 0 support , and intervals that include 0 do not give strong evidence of a difference.
Order matters the whole time:
- If the interval for is positive, population 1 likely has the larger proportion.
- If it is negative, population 2 likely has the larger proportion.
- If you reverse the order, you reverse the signs and flip the endpoints.
Example:
- For , suppose the interval is
- Then for , it becomes
A full interpretation has to name:
- population 1
- population 2
- the response/success
- the subtraction order,
Also, differences in proportions are often best said in percentage points.
- percentage points
- That does not automatically mean a 10% increase
Interpreting the Interval and the Confidence Level
A correct interpretation sounds like this:
“We are confident that the interval from to contains the true difference , where is the proportion of ___ in population 1 and is the proportion of ___ in population 2.”
That interval is about population proportions, not sample proportions. The sample proportions were used to build it, but they are not what the interval is estimating.
The confidence level is about the method’s long-run success rate:
That means:
- the parameter is fixed
- the samples change
- the interval changes from sample to sample
- any one interval either does contain the parameter or does not
Common wrong interpretations:
- “There is a chance the true difference is in this interval.”
- “ of the data are in the interval.”
- “The sample proportions are in the interval.”
- “Each population proportion is between the endpoints.”
Using the Interval to Judge Claims
This is where the interval becomes evidence.
- Identify the claim as a claim about .
- Check whether the claimed value is inside or outside the interval.
- Match the conclusion to what the interval says.
Claims about whether the proportions differ
- Entire interval above 0
- convincing evidence that
- also convincing evidence the population proportions differ
- Entire interval below 0
- convincing evidence that
- also convincing evidence the population proportions differ
- Interval contains 0
- insufficient evidence to conclude the population proportions differ
- this does not mean they are equal
If 0 is exactly an endpoint, it still counts as contains 0.
Claims about a specific difference
Suppose a claim says .
- If is inside the interval, that claim is plausible
- If is outside the interval, there is evidence against it
Claims about size
Suppose the claim is “ exceeds by more than 0.05.”
- If the whole interval is above , the data support that stronger claim
- If the interval includes values , you cannot support it
Writing the Conclusion in Context
Your conclusion has to match the sign and order of the interval.
Good AP Stats wording:
- “provides convincing evidence”
- “supports the claim”
- “insufficient evidence to conclude”
Example in context:
“We are 95% confident that the true difference in the proportion of adult residents who support the policy, , is between 0.027 and 0.193. Because the entire interval is above 0, the data provide convincing evidence that support is higher in City A by about 2.7 to 19.3 percentage points.”
The study design matters too:
- Random samples let you generalize to those populations
- Randomized experiments can support cause-and-effect
- Observational comparisons can compare groups, but not claim causation
All of this only works if the interval procedure was valid when built. That means randomization, independence, the 10% condition, and large counts were met.
Common Mistakes and Test-Day Checks
Students lose points here for wording more than math.
- Mixing up and
- Saying “different” when the interval contains 0
- Saying “equal” when the interval contains 0
- Forgetting to name both populations and the response
- Saying “percent” instead of “percentage points”
- Making a causal claim without random assignment
Key Takeaways
Parameter for a Two-Proportion Confidence Interval
p₁ − p₂, the true difference between two population proportions
Order of Subtraction
An interval for p₁ − p₂ must be interpreted in that order; reversing to p₂ − p₁ reverses the signs of the endpoints
Interpretation of a C% Confidence Interval for p₁ − p₂
We are C% confident that the interval from a to b contains the true difference p₁ − p₂, where p₁ and p₂ are the population proportions for the two groups in context
Interpretation of Confidence Level
In repeated random sampling with the same sample sizes from the same populations, about C% of confidence intervals produced by this method will contain the true difference p₁ − p₂
Plausible Values
Values inside the confidence interval are plausible for p₁ − p₂ at that confidence level; values outside are not
Interval Entirely Above 0
Provides convincing evidence that p₁ > p₂, so the population proportions differ
Interval Entirely Below 0
Provides convincing evidence that p₁ < p₂, so the population proportions differ
Interval Contains 0
If the interval contains 0, there is insufficient evidence to conclude that the two population proportions differ
Contains 0 Does Not Mean Equal
If 0 is in the interval, equality is plausible, but the data do not provide convincing evidence that p₁ = p₂
0 as an Endpoint
If 0 is an endpoint, the interval contains 0, so there is still insufficient evidence of a difference
Claim About Size of Difference
A claim such as p₁ − p₂ > k is supported only if the entire interval is greater than k
Specific Claimed Value
If a proposed value for p₁ − p₂ is in the interval, it is a plausible value; if it is outside, the interval provides evidence against it
Percentage Points
A difference such as 0.10 in proportions means 10 percentage points, not necessarily a 10 percent increase
Scope of Generalization
With independent random samples, conclusions can be generalized to the populations from which the samples were selected, not automatically to broader groups
Association vs. Causation with Sampled Groups
With samples from two existing groups, the interval can support that the population proportions differ, but not that group membership caused the difference
Randomized Experiment and Causation
In a randomized experiment, the interval can support a cause-and-effect conclusion about the treatments; generalization still depends on how the units were selected
Complete Interpretation of a Confidence Interval for p₁ − p₂
Includes the confidence level, that the interval contains the true difference p₁ − p₂, the two populations, the response/success, and the order of subtraction, all in context
Confidence Interval Estimates Difference, Not Individual Proportions
The interval estimates only p₁ − p₂; it does not separately locate p₁ and p₂ and does not estimate a ratio such as p₁/p₂
Particular Interval May or May Not Contain the Parameter
Because the interval is based on random samples, any one computed interval either contains the true difference p₁ − p₂ or it does not
Notes
Parameter for a Two-Proportion Confidence Interval
p₁ − p₂, the true difference between two population proportions
Order of Subtraction
An interval for p₁ − p₂ must be interpreted in that order; reversing to p₂ − p₁ reverses the signs of the endpoints
Interpretation of a C% Confidence Interval for p₁ − p₂
We are C% confident that the interval from a to b contains the true difference p₁ − p₂, where p₁ and p₂ are the population proportions for the two groups in context
Interpretation of Confidence Level
In repeated random sampling with the same sample sizes from the same populations, about C% of confidence intervals produced by this method will contain the true difference p₁ − p₂
Plausible Values
Values inside the confidence interval are plausible for p₁ − p₂ at that confidence level; values outside are not
Interval Entirely Above 0
Provides convincing evidence that p₁ > p₂, so the population proportions differ
Interval Entirely Below 0
Provides convincing evidence that p₁ < p₂, so the population proportions differ
Interval Contains 0
If the interval contains 0, there is insufficient evidence to conclude that the two population proportions differ
Contains 0 Does Not Mean Equal
If 0 is in the interval, equality is plausible, but the data do not provide convincing evidence that p₁ = p₂
0 as an Endpoint
If 0 is an endpoint, the interval contains 0, so there is still insufficient evidence of a difference
Claim About Size of Difference
A claim such as p₁ − p₂ > k is supported only if the entire interval is greater than k
Specific Claimed Value
If a proposed value for p₁ − p₂ is in the interval, it is a plausible value; if it is outside, the interval provides evidence against it
Percentage Points
A difference such as 0.10 in proportions means 10 percentage points, not necessarily a 10 percent increase
Scope of Generalization
With independent random samples, conclusions can be generalized to the populations from which the samples were selected, not automatically to broader groups
Association vs. Causation with Sampled Groups
With samples from two existing groups, the interval can support that the population proportions differ, but not that group membership caused the difference
Randomized Experiment and Causation
In a randomized experiment, the interval can support a cause-and-effect conclusion about the treatments; generalization still depends on how the units were selected
Complete Interpretation of a Confidence Interval for p₁ − p₂
Includes the confidence level, that the interval contains the true difference p₁ − p₂, the two populations, the response/success, and the order of subtraction, all in context
Confidence Interval Estimates Difference, Not Individual Proportions
The interval estimates only p₁ − p₂; it does not separately locate p₁ and p₂ and does not estimate a ratio such as p₁/p₂
Particular Interval May or May Not Contain the Parameter
Because the interval is based on random samples, any one computed interval either contains the true difference p₁ − p₂ or it does not
