Topic 5.2 Notes – Correlation
What Correlation Measures
The correlation coefficient describes the direction and strength of a linear association between two quantitative variables. It comes from paired data , so each -value is matched with its own -value.
A few facts you need cold:
- Sign tells direction
- means positive association
- means negative association
- means no linear association
- Magnitude tells strength
- close to 1 means strong linear association
- close to 0 means weak linear association
The endpoints have exact meanings:
- means all points lie exactly on an upward-sloping line
- means all points lie exactly on a downward-sloping line
Two properties students forget:
- Unit-free means changing inches to centimeters or pounds to kilograms does not change .
- Symmetry means switching and does not change .
That tells you what the number means. Now you need to connect it to what the graph looks like.
What Different Correlations Look Like
A scatterplot lets you estimate by looking at two things:
- Does the trend rise or fall?
- How tightly do the points hug a straight line?
These three plots show the pattern you should have in mind when you match a graph to a correlation value.
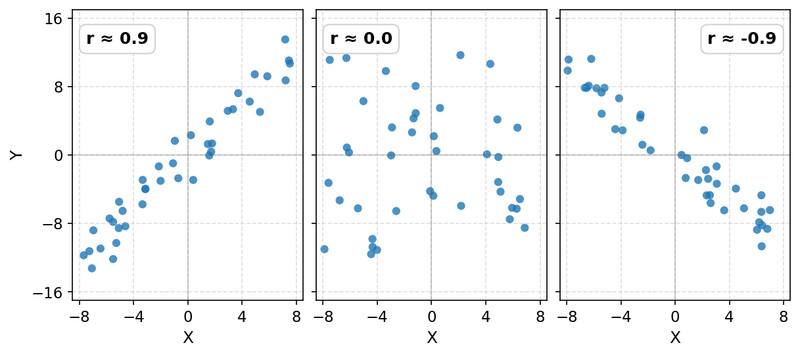
Scatterplots with positive, near-zero, and negative correlation
Quick matching:
- Tight upward band near
- Tight downward band near
- Loose cloud with little linear pattern near
There are no official cutoffs for weak, moderate, and strong. Your description should match both the value of and the actual graph.
One common mistake is mixing up steepness with correlation. A steep line and a shallow line can have the same . Correlation measures how tightly points follow a line, not how fast changes.
How to Interpret Correlation in Context
On a quiz or FRQ, don’t stop at “strong positive.” Say what the variables are and who the data are about.
A solid template is:
There is a [weak/moderate/strong] [positive/negative] linear association between ___ and ___ for ___; as ___ increases, ___ tends to [increase/decrease].
Example:
There is a strong positive linear association between weekly study time and quiz score for these students; as study time increases, quiz score tends to increase.
Correlation can support:
- statements about overall linear association
- wording like “tends to increase” or “is associated with”
Correlation cannot support:
- the slope or amount of change
- percent explained is later)
- perfect prediction
- causation
That last point matters a lot because leaves out many things the graph can show.
What Correlation Does Not Tell You
Correlation measures only linear association. You can have a strong relationship and still get if the pattern is curved.
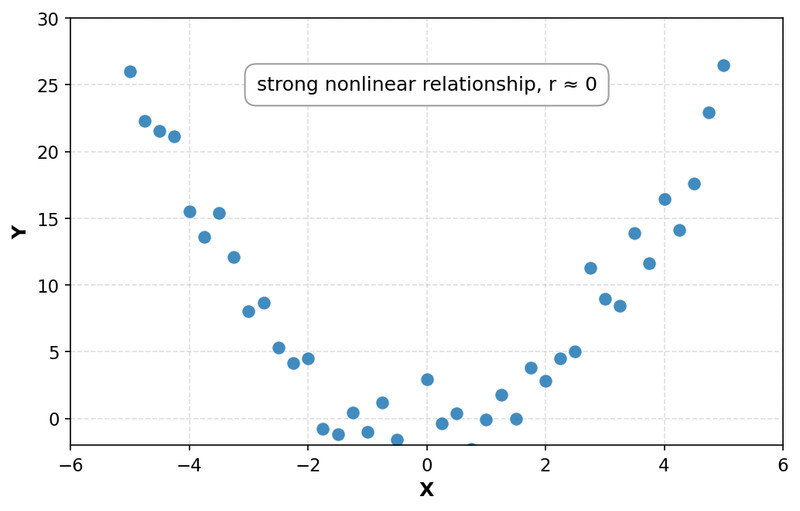
So always look at the scatterplot, because does not show:
- curvature
- clusters
- gaps
- unusual observations
Also, correlation is not resistant. One influential outlier can change the sign and size of a lot.
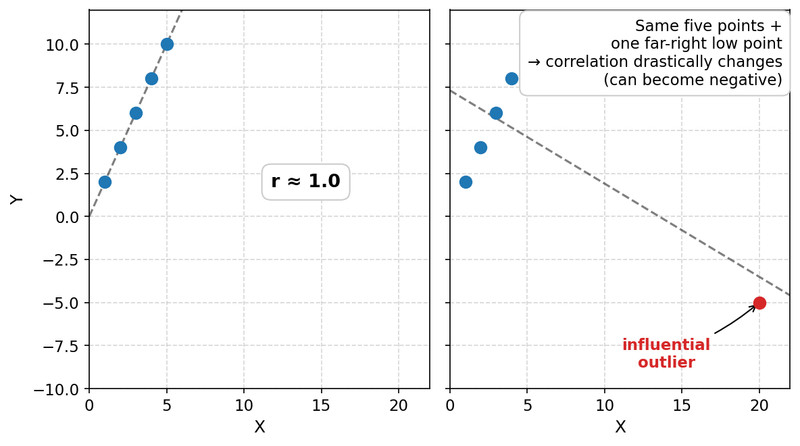
In the second graph, the five original points have , then one far-right low point pulls the overall correlation way down.
Clusters can also fool you. Two groups may each have their own pattern, and one overall can hide that.
One more technical case. If all -values are the same, or all -values are the same, then is undefined.
Correlation Is Not Causation
A correlation does not mean one variable causes the other to change.
Possible explanations for a correlation:
- may affect
- may affect (reverse causation)
- a third variable affects both
- chance or data-collection problems create the pattern
A lurking variable is a variable related to both measured variables that helps explain the association. Confounding means the effect of one variable is mixed up with another so you can’t separate them.
Classic example: Ice cream sales and drownings may be positively correlated, but hot weather is the lurking variable.
On the AP exam, use association language unless the study design justifies causation. Say “tends to” or “is associated with.” Even a correlation near or does not prove cause-and-effect.
Key Takeaways
Correlation Coefficient (r)
Numerical summary of the direction and strength of the linear association between two quantitative variables
Positive Linear Association
As one variable increases, the other tends to increase; shown by r > 0
Negative Linear Association
As one variable increases, the other tends to decrease; shown by r < 0
No Linear Association
r = 0; no linear association between two quantitative variables
Strength of Linear Association
Determined by |r|: values near 1 mean strong linear association, values near 0 mean weak linear association
Perfect Positive Linear Association
r = 1; all points lie exactly on a nonhorizontal straight line with positive slope
Perfect Negative Linear Association
r = -1; all points lie exactly on a nonhorizontal straight line with negative slope
Correlation Measures Only Linear Association
Correlation describes only linear association: a strong nonlinear relationship can have r = 0, and a large |r| does not by itself mean a linear model is appropriate
Scatterplot Before Correlation
Always examine the scatterplot before interpreting r because r does not show curvature, clusters, gaps, or unusual observations
Unit-Free
Correlation has no units because it is based on standardized values; changing measurement units does not change r
Symmetry of Correlation
The correlation between x and y is the same as the correlation between y and x
Not Resistant
Correlation is not resistant; an unusual observation can greatly change the sign and size of r
Influential Point
An unusual observation whose location has a large effect on a numerical summary such as r
Correlation Does Not Imply Causation
An association between two variables does not by itself show that changes in one cause changes in the other
Lurking Variable
A third variable associated with both measured variables that may help explain their relationship
Confounding
When the effects of a lurking variable cannot be separated from the effects of an explanatory variable
Undefined Correlation
Correlation is undefined if either variable has standard deviation 0; if all x-values or all y-values are the same, r cannot be computed
Notes
Correlation Coefficient (r)
Numerical summary of the direction and strength of the linear association between two quantitative variables
Positive Linear Association
As one variable increases, the other tends to increase; shown by r > 0
Negative Linear Association
As one variable increases, the other tends to decrease; shown by r < 0
No Linear Association
r = 0; no linear association between two quantitative variables
Strength of Linear Association
Determined by |r|: values near 1 mean strong linear association, values near 0 mean weak linear association
Perfect Positive Linear Association
r = 1; all points lie exactly on a nonhorizontal straight line with positive slope
Perfect Negative Linear Association
r = -1; all points lie exactly on a nonhorizontal straight line with negative slope
Correlation Measures Only Linear Association
Correlation describes only linear association: a strong nonlinear relationship can have r = 0, and a large |r| does not by itself mean a linear model is appropriate
Scatterplot Before Correlation
Always examine the scatterplot before interpreting r because r does not show curvature, clusters, gaps, or unusual observations
Unit-Free
Correlation has no units because it is based on standardized values; changing measurement units does not change r
Symmetry of Correlation
The correlation between x and y is the same as the correlation between y and x
Not Resistant
Correlation is not resistant; an unusual observation can greatly change the sign and size of r
Influential Point
An unusual observation whose location has a large effect on a numerical summary such as r
Correlation Does Not Imply Causation
An association between two variables does not by itself show that changes in one cause changes in the other
Lurking Variable
A third variable associated with both measured variables that may help explain their relationship
Confounding
When the effects of a lurking variable cannot be separated from the effects of an explanatory variable
Undefined Correlation
Correlation is undefined if either variable has standard deviation 0; if all x-values or all y-values are the same, r cannot be computed
