Topic 3.6 Notes – P-Values
What a P-Value Is
In a one-sample test for a population proportion, your hypotheses look like
- , , or
The p-value is the probability, assuming is true, of getting a test statistic as extreme or more extreme than the one you got.
A few parts of that definition matter a lot:
- Assuming is true means you pretend the true proportion really is .
- Observed test statistic means the -value from your actual sample. Once data are collected, that number is fixed.
- Null distribution means the distribution of possible test statistics you could get from many random samples if were true. For a one-proportion -test, this is usually the standard normal distribution.
“Extreme” depends on the alternative hypothesis. In the picture here, the shaded left-tail area represents the p-value for a test with .
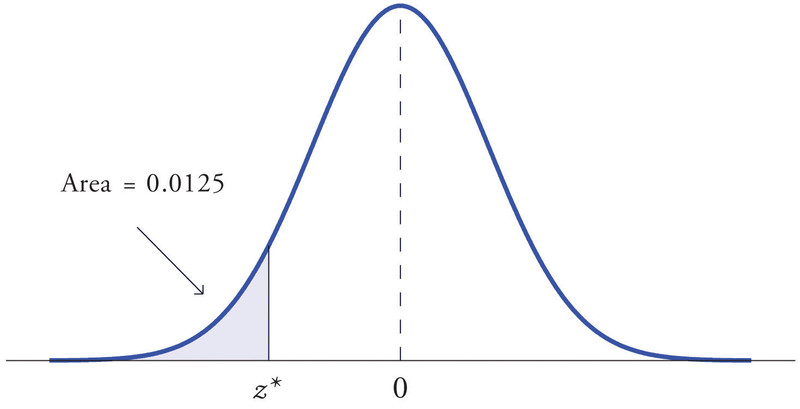
Left-tail p-value on the null distribution
Finding the P-Value from the Null Distribution
For a one-proportion test, the observed test statistic is
You use in the denominator because the whole calculation is built under the null assumption.
Which tail to use
If , the p-value is the right-tail area
If , the p-value is the left-tail area
If , use both tails
By symmetry, this is also
That absolute value is a common trap. If , you double the area beyond , not the huge left-tail complement of the wrong side.
Conditions for the normal null model
You need:
- a random sample or random assignment
- independence, plus the 10\% condition if sampling without replacement
- large counts under the null, so and
P-Values from Simulation
Sometimes the null distribution is simulated instead of using the normal model. Then the p-value is just the proportion of simulated statistics that are as extreme or more extreme than the observed one.
- → proportion at or above
- → proportion at or below
- → proportion at or below plus proportion at or above
In the simulated null distribution below, the observed statistic is , so for a right-tailed test you count the simulated values at or above 1.8. That highlighted right-tail proportion is the simulation p-value.
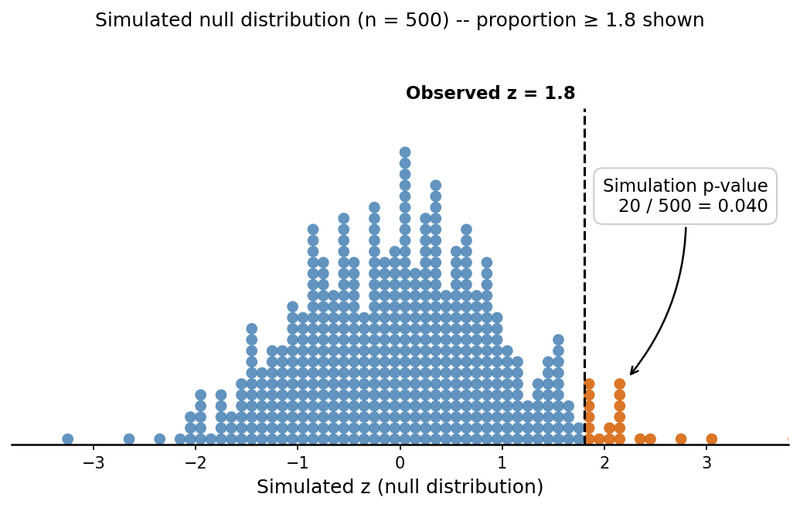
Simulation p-values should be close to the model-based p-values, but not identical. Simulation has random variation.
Interpreting the P-Value and Using It as Evidence
A correct interpretation must be in context and must begin with the null assumption.
Example wording:
- “Assuming the true proportion of commuters who use public transportation is 0.40, the probability of getting a sample proportion this high or higher, just by random sampling, is 0.0418.”
That works because it includes
- the null assumption in words
- the variable and population in context
- “as extreme or more extreme”
- the correct direction from the alternative
What the size means:
- Small p-value → the result would be unusual if were true, so there is evidence for
- Smaller p-value → stronger evidence against
- Large p-value → the result is not unusual under , so there is not convincing evidence for
A large p-value does not prove is true.
Common Mistakes with P-Values
These show up constantly on tests and FRQs:
- Saying the p-value is the probability that is true
- Forgetting the phrase assuming is true
- Picking tails based on the sample result instead of the stated alternative
- For two-sided tests, doubling without using
- Saying “probability of getting exactly this sample” instead of “as extreme or more extreme”
- Treating statistical significance as practical importance
- Ignoring bad design or failed conditions. A tiny p-value cannot rescue biased data.
Key Takeaways
P-Value
Probability, assuming H₀ is true, of getting a test statistic as extreme or more extreme than the observed one, in the direction specified by Hₐ; not the probability that H₀ is true
Null Distribution
The probability distribution of possible test-statistic values from repeated samples if H₀ were true
Upper-Tailed P-Value
For Hₐ: p > p₀, the p-value is P(Z ≥ z_obs), or in simulation, the proportion of statistics at or above z_obs
Lower-Tailed P-Value
For Hₐ: p < p₀, the p-value is P(Z ≤ z_obs), or in simulation, the proportion of statistics at or below z_obs
Two-Sided P-Value
For Hₐ: p ≠ p₀, the p-value is P(Z ≤ -|z_obs|) + P(Z ≥ |z_obs|), equivalently 2P(Z ≥ |z_obs|)); in simulation, the proportion at or below -|z_obs| plus the proportion at or above |z_obs|.
Simulated P-Value
The proportion of simulated test statistics in the null distribution that are as extreme or more extreme than the observed statistic, in the direction of Hₐ.
Small P-Value
The observed result would be unusual if H₀ were true, so it is evidence against H₀ and in favor of Hₐ; smaller p-values mean stronger evidence
Large Or Not-Small P-Value
The observed result would not be unusual if H₀ were true, so it does not provide convincing evidence for Hₐ; it does not show that H₀ is true
As Extreme Or More Extreme
Defined by Hₐ: outcomes in the direction of the alternative at least as far from the null result as the observed statistic; for two-sided tests, in either direction using |z_obs|.
Notes
P-Value
Probability, assuming H₀ is true, of getting a test statistic as extreme or more extreme than the observed one, in the direction specified by Hₐ; not the probability that H₀ is true
Null Distribution
The probability distribution of possible test-statistic values from repeated samples if H₀ were true
Upper-Tailed P-Value
For Hₐ: p > p₀, the p-value is P(Z ≥ z_obs), or in simulation, the proportion of statistics at or above z_obs
Lower-Tailed P-Value
For Hₐ: p < p₀, the p-value is P(Z ≤ z_obs), or in simulation, the proportion of statistics at or below z_obs
Two-Sided P-Value
For Hₐ: p ≠ p₀, the p-value is P(Z ≤ -|z_obs|) + P(Z ≥ |z_obs|), equivalently 2P(Z ≥ |z_obs|)); in simulation, the proportion at or below -|z_obs| plus the proportion at or above |z_obs|.
Simulated P-Value
The proportion of simulated test statistics in the null distribution that are as extreme or more extreme than the observed statistic, in the direction of Hₐ.
Small P-Value
The observed result would be unusual if H₀ were true, so it is evidence against H₀ and in favor of Hₐ; smaller p-values mean stronger evidence
Large Or Not-Small P-Value
The observed result would not be unusual if H₀ were true, so it does not provide convincing evidence for Hₐ; it does not show that H₀ is true
As Extreme Or More Extreme
Defined by Hₐ: outcomes in the direction of the alternative at least as far from the null result as the observed statistic; for two-sided tests, in either direction using |z_obs|.
