Topic 5.3 Notes – Linear Regression Models
What a Linear Regression Model Is
You use a linear regression model when a scatterplot of two quantitative variables looks approximately straight-line. The model uses an explanatory variable to predict a response variable .
A few pieces here matter a lot:
- means the predicted response, not the actual observed response .
- Simple linear regression means one explanatory variable and a straight-line model.
- The regression line is made of predicted points .
- Your actual data points are observed points , and they do not all have to lie on the line.
This kind of graph usually shows all of that at once, including the observed point, the predicted point on the line, and the residual between them.
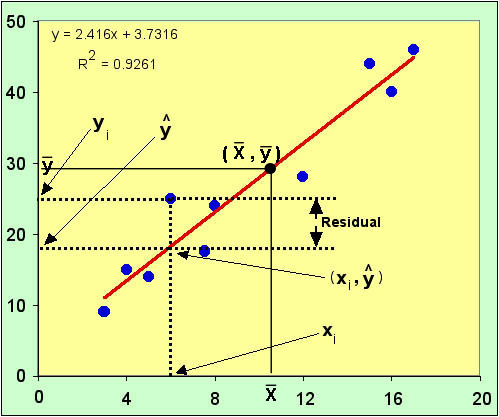
Regression line with predicted value and residual
Two common AP Stats reminders belong here:
- A model that predicts from does not automatically prove that causes .
- You also cannot just reverse the equation to predict from . Variable roles matter.
Reading the Equation
The equation tells you two things about the line: its slope and intercept.
Slope
The slope is how much the predicted response changes when increases by 1 unit.
- If , predicted goes up as goes up.
- If , predicted goes down as goes up.
- Units are response units per explanatory-variable unit.
Example. If , then for each 1-unit increase in , the predicted increases by 3.5 units.
Intercept
The intercept is the predicted response when .
- It always has a clear math meaning.
- It may have no useful real-world meaning.
If is impossible, unrealistic, or outside the data range, say that. On the exam, don’t force an interpretation that makes no sense.
Calculating and Reporting a Predicted Response
This is the calculation you’ll do most often.
Suppose the model is
and diameter is in centimeters.
For a tree with diameter cm,
So the prediction is 27.6 meters.
Say it like this in context:
- “According to the regression model, the predicted height of a mature red maple tree with diameter 30 cm is 27.6 meters.”
That wording matters. Don’t say “the height is 27.6 meters.” The model gives a prediction, not an observed fact.
Graphically, this means you go to , move up to the regression line, and read the corresponding .
Interpolation and Extrapolation
A prediction is only as trustworthy as where it falls relative to the observed -values.
Interpolation
Interpolation means predicting for an -value inside the observed range.
- If the original diameters were 12 to 46 cm, then is interpolation.
- This is usually more defensible because the model is being used where data exist.
Extrapolation
Extrapolation means predicting for an -value outside the observed range.
- If the same data used 12 to 46 cm, then is extrapolation.
- It is less reliable because it assumes the linear pattern continues beyond the data.
- The farther outside the range, the less reliable it usually is.
A predicted value can look reasonable and still be weakly supported. On the AP exam, say that clearly.
When the Model Is Reasonable and Where Students Go Wrong
A linear model makes sense only if the scatterplot looks roughly linear. A strong correlation alone is not enough if the pattern is curved.
Also check whether the prediction makes sense in context:
- impossible values like negative height
- values beyond a fixed scale
- predictions for individuals very different from those in the original data
Big mistakes students make:
- confusing with
- leaving out units or context
- treating a prediction as an observed value
- ignoring interpolation vs extrapolation
- reversing explanatory and response variables
- using causal language from regression alone
Key Takeaways
Slope
In a regression equation, b; the change in the predicted response ŷ for a one-unit increase in x
Y-Intercept
In a regression equation, a; the predicted response when x = 0
Calculate A Predicted Response
Substitute the given x-value into ŷ = a + bx and evaluate; report the result as the predicted response, not the observed y
Interpolation
Using a regression model to predict a response for an x-value within the observed interval of x-values used to determine the regression line; generally more defensible than extrapolation
Extrapolation
Using a regression model to predict a response for an x-value beyond the observed interval of x-values used to determine the regression line; the farther beyond the range, the less reliable the prediction generally is
Linear Regression Model
ŷ = a + bx; a linear equation that uses one quantitative explanatory variable x to predict the response variable y when the relationship appears approximately linear, where ŷ is the predicted response, a is the y-intercept, and b is the slope
Notes
Slope
In a regression equation, b; the change in the predicted response ŷ for a one-unit increase in x
Y-Intercept
In a regression equation, a; the predicted response when x = 0
Calculate A Predicted Response
Substitute the given x-value into ŷ = a + bx and evaluate; report the result as the predicted response, not the observed y
Interpolation
Using a regression model to predict a response for an x-value within the observed interval of x-values used to determine the regression line; generally more defensible than extrapolation
Extrapolation
Using a regression model to predict a response for an x-value beyond the observed interval of x-values used to determine the regression line; the farther beyond the range, the less reliable the prediction generally is
Linear Regression Model
ŷ = a + bx; a linear equation that uses one quantitative explanatory variable x to predict the response variable y when the relationship appears approximately linear, where ŷ is the predicted response, a is the y-intercept, and b is the slope
