Topic 4.7 Notes – Constructing a Confidence Interval for the Difference Between Two Population Means
What a Two-Sample t-Interval Estimates
This interval estimates a difference in population means. The parameter is , and you have to name it in context.
If group 1 is students using Method A and group 2 is students using Method B, then the parameter might be “the population mean quiz score for students using Method A minus the population mean quiz score for students using Method B.”
A few things have to stay straight:
- The point estimate is the sample difference .
- Order matters. If you switch to , every sign flips, including the interval.
- This is for a quantitative response, like time, height, score, or amount.
- The groups must be independent.
- Population standard deviations are unknown, which is why this is a -interval.
- This is not for proportions or categorical data.
- This is not for matched pairs. If the data are paired, you make one difference per pair and use a one-sample -interval on those differences.
When This Procedure Is Appropriate
Before calculating anything, the setting has to match the method.
You need all of these:
- a quantitative response variable
- two groups or populations
- independent samples or independently assigned treatment groups
- a goal of estimating a difference in means
- unknown population standard deviations
Then check the inference conditions.
Conditions
- Randomization
- You need two independent random samples, or a randomized experiment with two treatments.
- Independence between groups comes from the study design.
- 10% condition
- If sampling without replacement, check both groups.
- and
- You do not need this for a randomized experiment.
- Sample data condition
- Either both populations are approximately normal, or both sample sizes are at least 30.
- If either sample is under 30, then both sample distributions should have no strong skewness or outliers.
That “both groups” point gets tested a lot. One nice-looking sample does not rescue the other one.
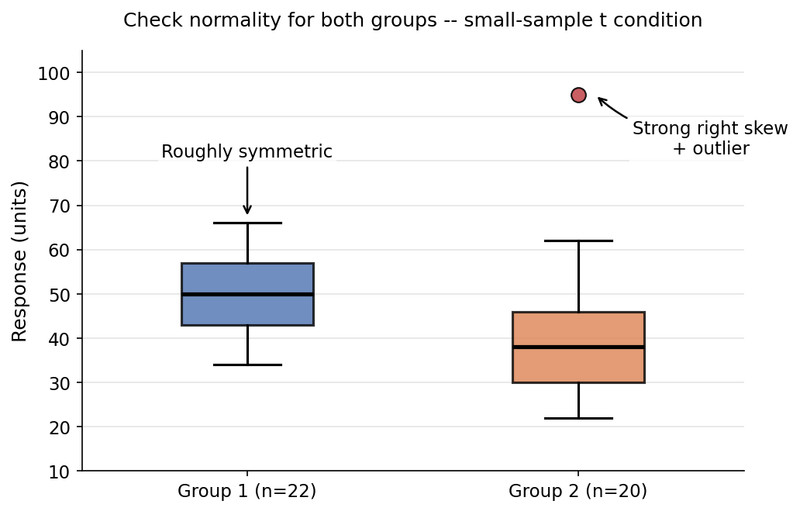
Checking normality in both groups
Building the Interval
Here’s the full structure for a two-sample -interval for .
Parameter and procedure
State that you are constructing a two-sample -interval for .Point estimate
Standard error
The variances add because the samples are independent. You do not add standard deviations directly.
Critical value
Use for your confidence level and appropriate degrees of freedom.- Technology finds df for you.
- It will be between the smaller of and , and .
- With a table, using the smaller df is conservative.
Margin of error
Confidence interval
Quick example. If , , , , , , then the center is . Everything is built around that 5, with the same subtraction order.
Calculator note: use 2-SampTInt and if it asks about pooling, choose No.
What the Interval Means
A correct interpretation sounds like this:
“We are 95% confident that the true difference in population mean waiting time, , is between 1.2 and 4.8 minutes.”
A few meanings come from the interval itself:
- The interval estimates the population difference, not the sample difference.
- The center is .
- A wider margin of error means a wider interval.
- If 0 is in the interval, a difference of 0 is plausible, so there is no clear evidence of a population mean difference at that confidence level.
- If 0 is not in the interval, a real difference in population means is plausible.
- If the whole interval is positive, population 1 likely has the larger mean.
- If the whole interval is negative, population 1 likely has the smaller mean.
Common Mistakes to Avoid
- Treating matched pairs like independent samples
- Naming the procedure but not defining the parameter in context
- Switching subtraction order halfway through
- Writing vague condition checks instead of using study details
- Checking the normality condition for only one sample
- Using instead of
- Choosing pooled or assuming equal variances
- Interpreting the interval as about individual values instead of population means
- Forgetting the units
Key Takeaways
Two-Sample t-Interval for the Difference Between Two Population Means
Confidence interval procedure for estimating μ1 − μ2 from two independent groups with a quantitative response when population standard deviations are unknown
Parameter for a Two-Sample t-Interval
μ1 − μ2: the difference between the two population means, stated in context with the response variable, populations, and subtraction order
Randomization Condition
Data come from two independent random samples or from a randomized experiment with random assignment to two treatments; the two groups must be independent, not matched
10% Condition
When sampling without replacement, each sample size must be no more than 10% of its population: n1 ≤ 0.10N1 and n2 ≤ 0.10N2; not needed for randomized experiments
Sample Data Condition
Sampling distribution of x̄1 − x̄2 is approximately normal: both populations are approximately normal, or both n1 and n2 are at least 30, or if either sample is under 30 then both samples show no strong skewness or outliers
Point Estimate for μ1 − μ2
x̄1 − x̄2, the difference between the sample means
Standard Error for x̄1 − x̄2
SE = √(s1^2/n1 + s2^2/n2), the estimated variability of the difference in sample means
Margin of Error for a Two-Sample t-Interval
ME = t*√(s1^2/n1 + s2^2/n2)
Confidence Interval Formula for μ1 − μ2
(x̄1 − x̄2) ± t*√(s1^2/n1 + s2^2/n2)
Degrees of Freedom for a Two-Sample t-Interval
Usually found with technology; df may be noninteger and falls between min(n1 - 1, n2 - 1) and n1 + n2 - 2. If using a t-table, use df = min(n1 - 1, n2 - 1) as a conservative choice
Unpooled Two-Sample t-Procedure
The standard AP Stats method for two means; it does not assume equal population variances, so calculator pooled setting should be No
Matched Pairs vs. Independent Two-Sample Means
Matched pairs uses pairwise differences and a one-sample t-interval; independent two-sample means uses two unrelated groups and a two-sample t-interval
Order of Subtraction
The order in μ1 − μ2 must match x̄1 − x̄2, the reported interval, and the units context; reversing the order changes only the sign
2-SampTInt
TI-84 command for a two-sample t-interval for μ1 - μ2; enter x̄1, s1, n1, x̄2, s2, n2, choose the confidence level, and set pooled to No
t* Critical Value
Positive critical value from the appropriate t-distribution that leaves the central C% between -t* and t*.
Notes
Two-Sample t-Interval for the Difference Between Two Population Means
Confidence interval procedure for estimating μ1 − μ2 from two independent groups with a quantitative response when population standard deviations are unknown
Parameter for a Two-Sample t-Interval
μ1 − μ2: the difference between the two population means, stated in context with the response variable, populations, and subtraction order
Randomization Condition
Data come from two independent random samples or from a randomized experiment with random assignment to two treatments; the two groups must be independent, not matched
10% Condition
When sampling without replacement, each sample size must be no more than 10% of its population: n1 ≤ 0.10N1 and n2 ≤ 0.10N2; not needed for randomized experiments
Sample Data Condition
Sampling distribution of x̄1 − x̄2 is approximately normal: both populations are approximately normal, or both n1 and n2 are at least 30, or if either sample is under 30 then both samples show no strong skewness or outliers
Point Estimate for μ1 − μ2
x̄1 − x̄2, the difference between the sample means
Standard Error for x̄1 − x̄2
SE = √(s1^2/n1 + s2^2/n2), the estimated variability of the difference in sample means
Margin of Error for a Two-Sample t-Interval
ME = t*√(s1^2/n1 + s2^2/n2)
Confidence Interval Formula for μ1 − μ2
(x̄1 − x̄2) ± t*√(s1^2/n1 + s2^2/n2)
Degrees of Freedom for a Two-Sample t-Interval
Usually found with technology; df may be noninteger and falls between min(n1 - 1, n2 - 1) and n1 + n2 - 2. If using a t-table, use df = min(n1 - 1, n2 - 1) as a conservative choice
Unpooled Two-Sample t-Procedure
The standard AP Stats method for two means; it does not assume equal population variances, so calculator pooled setting should be No
Matched Pairs vs. Independent Two-Sample Means
Matched pairs uses pairwise differences and a one-sample t-interval; independent two-sample means uses two unrelated groups and a two-sample t-interval
Order of Subtraction
The order in μ1 − μ2 must match x̄1 − x̄2, the reported interval, and the units context; reversing the order changes only the sign
2-SampTInt
TI-84 command for a two-sample t-interval for μ1 - μ2; enter x̄1, s1, n1, x̄2, s2, n2, choose the confidence level, and set pooled to No
t* Critical Value
Positive critical value from the appropriate t-distribution that leaves the central C% between -t* and t*.
