Topic 3.3 Notes – Constructing a Confidence Interval for a Population Proportion
What a Confidence Interval for a Population Proportion Does
This is for one population and one categorical variable with two outcomes. You choose one outcome to call success, even if it isn’t a good thing.
If people in a sample of size are successes, then the point estimate is
That is your sample proportion. The confidence interval takes that single number and builds a range of plausible values for the true population proportion .
A complete parameter statement has to name all three parts:
- proportion
- success category
- population
Example: the proportion of all seniors at Central High who have a driver’s license.
This procedure is called a one-sample -interval for a population proportion. It is the right tool here, and only here.
It is not for:
- a population mean
- comparing two population proportions
- a categorical variable with 3 or more categories all at once
Conditions for a One-Sample Proportion Interval
All three conditions matter because each one justifies a different part of the method.
Randomization
Your data should come from a random sample.
On an FRQ, say how the sample was chosen in the prompt, like:
- “A simple random sample of 150 voters was selected.”
Just writing “random” is usually too vague. Also, a huge sample does not fix bias from a convenience sample or voluntary response sample.
Independence and the 10% condition
If sampling is without replacement, you need
This lets you treat observations as approximately independent.
If the sample is effectively with replacement, or the population is enormous compared with the sample, you may not need a separate 10% check.
Normality
For a confidence interval for a proportion, use the observed counts:
Equivalent form:
These conditions are what let us use the normal model for the interval, with the familiar middle 95% between about and .
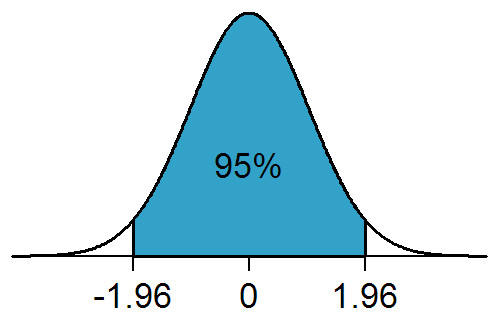
A common mistake is using . That rule is for means, not proportions.
Building the Interval
Here’s what the full process looks like with numbers. Suppose 84 of 120 randomly selected students say they have a school ID with them.
Parameter in context
the proportion of all students at the school who have a school ID with them.Procedure
One-sample -interval for a population proportion.Conditions
- random sample given
- if population is at least 1200, then
- successes , failures , both at least 10
Point estimate
Standard error
Critical value
Common values:- 90% → 1.645
- 95% → 1.96
- 99% → 2.576
Margin of error
Interval
So the interval is about .
Calculator shortcut: 1-PropZInt with , , and C-Level.
Standard Error, Margin of Error, and Sample Size
The standard error is the estimated standard deviation of . It tells you how much sample proportions typically vary from sample to sample.
For confidence intervals, use in the SE formula because the true is unknown.
The margin of error is how far the interval goes on each side of . The full width is .
If an interval is , then
Planning a sample size uses
If no estimate for is available, use . That gives the largest required sample size. Always round up.
What Students Mix Up
- vs.
is the unknown population proportion. is the known sample proportion. - Confidence interval vs. test
A confidence interval uses in the SE. A one-proportion significance test uses the hypothesized . - vs.
TI calculators usually want the count of successes , not the decimal proportion. - Normality check
Use observed successes and failures, not . - Conditions vs. bias
Passing the formulas does not rescue bad sampling. - Parameter wording
If you forget the population or the success category, you can lose credit.
Key Takeaways
Confidence Interval
An interval estimate for a population parameter; a range of plausible values for the parameter based on sample data
Population Proportion (p)
The proportion of the population in the success category; fixed but unknown
Sample Proportion (p̂)
The statistic x/n; the point estimate of the population proportion p
Success
The response category being counted in a categorical variable; just a label, not necessarily a favorable outcome
Parameter in Context for a Population Proportion
A statement that names the proportion, the success/response category, and the population of interest
Point Estimate
The sample statistic used to estimate a population parameter; for a proportion interval, it is p̂.
Randomization Condition
The data must come from a random sample from the population of interest
10% Condition
When sampling without replacement, the population size must be at least 10 times the sample size: N ≥ 10n
Normality Condition for a Proportion Interval
The observed numbers of successes and failures must both be at least 10: x ≥ 10 and n − x ≥ 10, equivalently n p̂ ≥ 10 and n(1 − p̂) ≥ 10
Critical Value (z*)
The standard normal value with −z* and z* enclosing the middle C% of the distribution for the chosen confidence level
Common z* Values
90%: 1.645; 95%: 1.960; 99%: 2.576
Standard Error of p̂
SE = √(p̂(1−p̂)/n); the estimated standard deviation of the sampling distribution of p̂, describing the typical sampling variability of p̂ around p
Margin of Error (MOE) for a Proportion Interval
MOE = z*√(p̂(1−p̂)/n); the amount added to and subtracted from p̂, equal to half the interval width
Confidence Interval Structure
Point estimate ± margin of error; for a proportion interval, center = p̂ and MOE is half the interval width
Sample Size Formula for a Proportion Margin of Error
n = (z*^2 p̂(1−p̂)) / MOE^2; round up to the next whole number
Conservative Planning Value p̂ = 0.5
Use p̂ = 0.5 in the sample-size formula when no reasonable estimate is available; it gives the largest required sample size
One-Sample z-Interval for a Population Proportion
The confidence interval procedure for estimating one population proportion p: p̂ ± z*√(p̂(1−p̂)/n)
Notes
Confidence Interval
An interval estimate for a population parameter; a range of plausible values for the parameter based on sample data
Population Proportion (p)
The proportion of the population in the success category; fixed but unknown
Sample Proportion (p̂)
The statistic x/n; the point estimate of the population proportion p
Success
The response category being counted in a categorical variable; just a label, not necessarily a favorable outcome
Parameter in Context for a Population Proportion
A statement that names the proportion, the success/response category, and the population of interest
Point Estimate
The sample statistic used to estimate a population parameter; for a proportion interval, it is p̂.
Randomization Condition
The data must come from a random sample from the population of interest
10% Condition
When sampling without replacement, the population size must be at least 10 times the sample size: N ≥ 10n
Normality Condition for a Proportion Interval
The observed numbers of successes and failures must both be at least 10: x ≥ 10 and n − x ≥ 10, equivalently n p̂ ≥ 10 and n(1 − p̂) ≥ 10
Critical Value (z*)
The standard normal value with −z* and z* enclosing the middle C% of the distribution for the chosen confidence level
Common z* Values
90%: 1.645; 95%: 1.960; 99%: 2.576
Standard Error of p̂
SE = √(p̂(1−p̂)/n); the estimated standard deviation of the sampling distribution of p̂, describing the typical sampling variability of p̂ around p
Margin of Error (MOE) for a Proportion Interval
MOE = z*√(p̂(1−p̂)/n); the amount added to and subtracted from p̂, equal to half the interval width
Confidence Interval Structure
Point estimate ± margin of error; for a proportion interval, center = p̂ and MOE is half the interval width
Sample Size Formula for a Proportion Margin of Error
n = (z*^2 p̂(1−p̂)) / MOE^2; round up to the next whole number
Conservative Planning Value p̂ = 0.5
Use p̂ = 0.5 in the sample-size formula when no reasonable estimate is available; it gives the largest required sample size
One-Sample z-Interval for a Population Proportion
The confidence interval procedure for estimating one population proportion p: p̂ ± z*√(p̂(1−p̂)/n)
