Topic 3.9 Notes – Sampling Distributions for the Difference Between Sample Proportions
What the Sampling Distribution of p̂₁ − p̂₂ Is
This shows up when you compare two groups on one categorical outcome, usually called success.
- Group 1 has population proportion
- Group 2 has population proportion
- From samples, you get where is the number of successes and is the sample size.
The parameter is the true difference .
The statistic is the sample difference .
The sampling distribution of is the distribution of all possible values of that sample difference from many repeated independent samples, or from many repeated random assignments in an experiment.
A few details matter a lot:
- Order matters. If you define the difference as group 1 minus group 2, keep that order everywhere.
- Reversing the order changes the sign of the difference and the center.
- Reversing the order does not change the standard deviation.
- Since proportions are between 0 and 1, values of must be between and .
The graph below ties those ideas together. Switching from to flips the distribution across 0, so the center moves from positive to negative, but the spread stays the same.
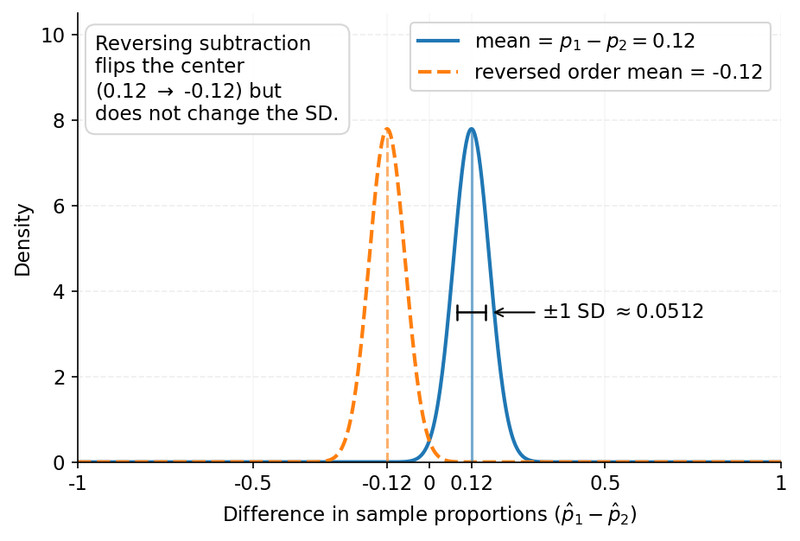
Sampling distributions for and
Center, Spread, and Shape
The mean of the sampling distribution is
That means over many repeated samples, the sample difference lands at the true population difference on average. This is the unbiased idea.
The standard deviation is
Why are those two parts added if the proportions are subtracted? Because the groups are independent, so the variances add.
- Do not add standard deviations.
- Add the variances inside the square root, then take the square root.
- Bigger or makes the standard deviation smaller.
The exact distribution is discrete because proportions come from counts. When counts are large enough, it is approximately normal, centered at with the SD above.
Conditions for Using the Normal Model
You check conditions for each group separately, not with one combined sample.
Randomization and independence
- For sampling, you need two independent random samples, one from each population.
- For experiments, you need random assignment to create independent groups.
- This does not apply to paired or matched data.
The 10% condition
This only matters for sampling without replacement from finite populations.
- Check
- Check
You do not need this for randomized experiments or sampling with replacement.
Large counts
All four expected counts must be at least 10:
These use population proportions and , not sample proportions. If this fails, the mean and SD formulas still describe center and spread, but the normal approximation may be poor.
Finding Probabilities with p̂₁ − p̂₂
Suppose , , , , and you want .
- Define the order. Here it is first group minus second group.
- Check conditions.
Large counts work since , , , . - Compute the mean.
- Compute the SD.
- Standardize:
- Use the standard normal distribution.
In context, about 5.9% of repeated sample pairs would produce a sample proportion difference of at least 0.20.
Interpretation and Common Mistakes
Your interpretation always has to name both groups and keep the subtraction order.
- Mean interpretation
Over many repeated samples, the sample proportion for group 1 minus the sample proportion for group 2 would average . - Standard deviation interpretation
typically varies from the true difference by about the SD. - Probability interpretation
This is the chance of getting a certain sample difference from repeated sampling, not the chance that changes.
Common mistakes:
- switching from to halfway through
- doing one 10% check instead of one for each population
- checking only total sample size for large counts
- plugging in sample proportions when the problem gives true and
- claiming one group causes a higher proportion when the data came from samples, not a randomized experiment
Key Takeaways
Difference In Sample Proportions (p̂1 − p̂2)
Statistic p̂1 − p̂2, used to estimate the difference in population proportions p1 − p2
Difference In Population Proportions (p1 − p2)
Parameter giving the true difference in success proportions for population 1 minus population 2
Mean Of The Sampling Distribution Of p̂1 − p̂2
μ_p̂1−p̂2 = p1 − p2
Standard Deviation Of The Sampling Distribution Of p̂1 − p̂2
σ_p̂1−p̂2 = sqrt[p1(1 − p1)/n1 + p2(1 − p2)/n2].
Randomization Condition
For samples: use two independent random samples. For experiments: randomly assign treatments to the experimental units
10% Condition
When sampling without replacement, each sample must be no more than 10% of its own population: n1 ≤ 0.10N1 and n2 ≤ 0.10N2
Large-Counts Condition
Approximate normality requires all four expected counts to be at least 10: n1p1 ≥ 10, n1(1 − p1) ≥ 10, n2p2 ≥ 10, and n2(1 − p2) ≥ 10
Sampling Distribution Of p̂1 − p̂2
Distribution of the values of p̂1 − p̂2 over repeated independent random samples of the same sizes, or repeated random assignment in an experiment
Approximate Normal Model For p̂1 − p̂2
If conditions are met, p̂1 − p̂2 is approximately normal with mean p1 − p2 and standard deviation sqrt[p1(1 − p1)/n1 + p2(1 − p2)/n2].
Z-Score For A Difference In Sample Proportions
z = [d − (p1 − p2)] / sqrt[p1(1 − p1)/n1 + p2(1 − p2)/n2].
Order Of Subtraction
Keep the same group first in both p1 − p2 and p̂1 − p̂2; reversing order changes the sign of the difference but not the standard deviation
Probability Interpretation For p̂1 − p̂2
A probability about p̂1 − p̂2 is the long-run proportion of repeated samples or random assignments that produce that result, not a probability about fixed p1 and p2
Paired Or Matched Data Exclusion
This procedure does not apply to paired or matched observations because the two sample proportions are associated, not independent
Notes
Difference In Sample Proportions (p̂1 − p̂2)
Statistic p̂1 − p̂2, used to estimate the difference in population proportions p1 − p2
Difference In Population Proportions (p1 − p2)
Parameter giving the true difference in success proportions for population 1 minus population 2
Mean Of The Sampling Distribution Of p̂1 − p̂2
μ_p̂1−p̂2 = p1 − p2
Standard Deviation Of The Sampling Distribution Of p̂1 − p̂2
σ_p̂1−p̂2 = sqrt[p1(1 − p1)/n1 + p2(1 − p2)/n2].
Randomization Condition
For samples: use two independent random samples. For experiments: randomly assign treatments to the experimental units
10% Condition
When sampling without replacement, each sample must be no more than 10% of its own population: n1 ≤ 0.10N1 and n2 ≤ 0.10N2
Large-Counts Condition
Approximate normality requires all four expected counts to be at least 10: n1p1 ≥ 10, n1(1 − p1) ≥ 10, n2p2 ≥ 10, and n2(1 − p2) ≥ 10
Sampling Distribution Of p̂1 − p̂2
Distribution of the values of p̂1 − p̂2 over repeated independent random samples of the same sizes, or repeated random assignment in an experiment
Approximate Normal Model For p̂1 − p̂2
If conditions are met, p̂1 − p̂2 is approximately normal with mean p1 − p2 and standard deviation sqrt[p1(1 − p1)/n1 + p2(1 − p2)/n2].
Z-Score For A Difference In Sample Proportions
z = [d − (p1 − p2)] / sqrt[p1(1 − p1)/n1 + p2(1 − p2)/n2].
Order Of Subtraction
Keep the same group first in both p1 − p2 and p̂1 − p̂2; reversing order changes the sign of the difference but not the standard deviation
Probability Interpretation For p̂1 − p̂2
A probability about p̂1 − p̂2 is the long-run proportion of repeated samples or random assignments that produce that result, not a probability about fixed p1 and p2
Paired Or Matched Data Exclusion
This procedure does not apply to paired or matched observations because the two sample proportions are associated, not independent
