Topic 3.15 Notes – Carrying Out a Chi-Square Test for Homogeneity or Independence
What a Chi-Square Test for Homogeneity or Independence Does
These tests work with categorical data in a two-way table. They compare observed counts to expected counts under .
A two-way table like the one below is the basic setup for both tests.
- Test of independence
- You have one random sample from one population
- You record two categorical variables on each individual
- You ask whether the variables are associated
- Test of homogeneity
- You have separate random samples from different populations, or different treatments in an experiment
- You measure one categorical response variable
- You ask whether the category distributions are the same across groups
Same calculations, different story. That is a favorite AP Stats distinction.
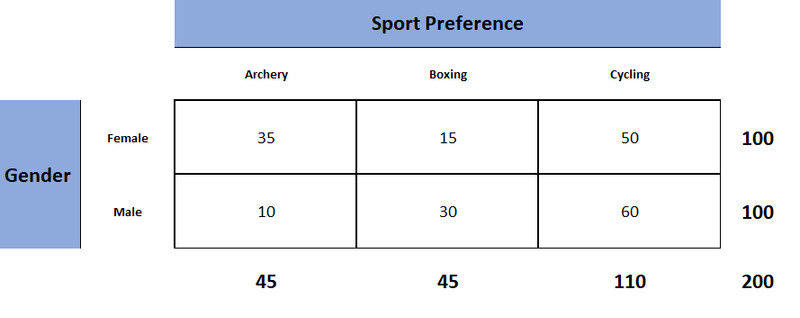
Two-way table of observed counts
Keep the full inference setup visible when you do the test. You still need hypotheses, conditions, and a conclusion in context.
Expected Counts and the Chi-Square Statistic
An expected count is what should land in a cell if were true.
A quick example. If a cell is in a row with total 120, a column with total 156, and the table total is 300, then
A few things students forget:
- Expected counts come from the null hypothesis
- independence means counts expected if the variables are unrelated
- homogeneity means counts expected if all groups have the same distribution
- Expected counts can be decimals
- The expected table keeps the same row totals and column totals as the observed table
The test statistic is
- Use only the interior cells, never the row or column totals
- Each cell’s fraction is that cell’s contribution
- always
- Bigger means bigger disagreement between observed and expected
The statistic does not tell you direction. To describe the pattern, compare observed and expected counts cell by cell.
Carrying Out the Test
- Identify the procedure
- One sample + two variables = independence
- Multiple samples/treatments + one response = homogeneity
- State hypotheses in context
- Independence
says the variables are independent in the population.
says the variables are associated. - Homogeneity
says the distributions are the same across populations or treatments.
says they are not all the same.
- Independence
- Check conditions
- Random sample(s) or randomized experiment
- 10% condition for sampling without replacement
- Every expected count > 5
- Calculate expected counts and show at least one example
- Compute from all interior cells
- Find degrees of freedom
- Find the p-value
Chi-square tests here are always right-tailed.
P-Value, Decision, and Conclusion
The p-value is the probability, assuming is true, of getting a chi-square statistic at least as large as the one observed.
Decision rule:
- if p-value , reject
- if p-value , fail to reject
Your conclusion has to match the test:
- Independence
“There is convincing evidence of an association between commuting method and residential zone among adult residents of the town.” - Homogeneity
“There is convincing evidence that the distribution of commuting method differs between central-zone and outer-zone adult residents.”
After a significant result, describe the pattern carefully using observed vs. expected counts or conditional percents. Say which categories were higher or lower than expected. Don’t claim every category differs.
Common Mistakes and Scope of Inference
Common errors:
- Checking the large-counts condition with observed counts instead of expected counts
- Including totals in the sum
- Using for df instead of
- Forgetting the p-value is a right-tail area
- Saying “accept ” after a nonsignificant result
Scope of inference depends on design:
- Random sampling lets you generalize to the population(s)
- Random assignment lets you talk about cause and effect for treatments
- An observational study can show association, not causation
- Statistical significance does not measure strength or explain why the relationship exists
Key Takeaways
Chi-Square Test for Independence
Uses counts in a two-way table from one random sample to test whether two categorical variables are independent, or equivalently whether there is an association, in one population
Chi-Square Test for Homogeneity
Uses counts in a two-way table from two or more independent random samples or from a randomized experiment to test whether the distribution of one categorical variable is the same across populations or treatments
Expected Count
Count expected in a cell if H₀ is true; expected count = (row total × column total) / table total; expected counts need not be whole numbers
Chi-Square Statistic
χ² = Σ (O − E)² / E over all non-total cells; measures total disagreement between observed and expected counts
Degrees of Freedom for a Chi-Square Test
Df = (r − 1)(c − 1), using the number of non-total rows and columns
Decision Rule with α
If p-value ≤ α, reject H₀; if p-value > α, fail to reject H₀
Conclusion for Independence
Reject H₀: convincing evidence of an association between the two categorical variables in the population; fail to reject H₀: not convincing evidence of an association
Conclusion for Homogeneity
Reject H₀: convincing evidence that the distribution of the categorical variable differs across the populations or treatments; fail to reject H₀: not convincing evidence that the distributions differ
Same Numerical Procedure, Different Context
Homogeneity and independence use the same expected counts, χ², degrees of freedom, and p-value; the study design determines the procedure name, hypotheses, and conclusion
P-Value for a Chi-Square Test
Probability, assuming H₀ is true in context, of getting a chi-square statistic at least as large as the observed value; a chi-square test for homogeneity or independence is always right-tailed
Conditions for a Chi-Square Test for Homogeneity or Independence
Randomization; when sampling without replacement, each sample size is no more than 10% of its population; and every expected cell count is greater than 5, checked with expected counts, not observed counts
10% Condition
When sampling without replacement, each sample size must be no more than 10% of its population size; not required for a randomized experiment
Randomization Condition
Independence: random sample from one population; homogeneity: independent random samples from the populations or data from a randomized experiment
Notes
Chi-Square Test for Independence
Uses counts in a two-way table from one random sample to test whether two categorical variables are independent, or equivalently whether there is an association, in one population
Chi-Square Test for Homogeneity
Uses counts in a two-way table from two or more independent random samples or from a randomized experiment to test whether the distribution of one categorical variable is the same across populations or treatments
Expected Count
Count expected in a cell if H₀ is true; expected count = (row total × column total) / table total; expected counts need not be whole numbers
Chi-Square Statistic
χ² = Σ (O − E)² / E over all non-total cells; measures total disagreement between observed and expected counts
Degrees of Freedom for a Chi-Square Test
Df = (r − 1)(c − 1), using the number of non-total rows and columns
Decision Rule with α
If p-value ≤ α, reject H₀; if p-value > α, fail to reject H₀
Conclusion for Independence
Reject H₀: convincing evidence of an association between the two categorical variables in the population; fail to reject H₀: not convincing evidence of an association
Conclusion for Homogeneity
Reject H₀: convincing evidence that the distribution of the categorical variable differs across the populations or treatments; fail to reject H₀: not convincing evidence that the distributions differ
Same Numerical Procedure, Different Context
Homogeneity and independence use the same expected counts, χ², degrees of freedom, and p-value; the study design determines the procedure name, hypotheses, and conclusion
P-Value for a Chi-Square Test
Probability, assuming H₀ is true in context, of getting a chi-square statistic at least as large as the observed value; a chi-square test for homogeneity or independence is always right-tailed
Conditions for a Chi-Square Test for Homogeneity or Independence
Randomization; when sampling without replacement, each sample size is no more than 10% of its population; and every expected cell count is greater than 5, checked with expected counts, not observed counts
10% Condition
When sampling without replacement, each sample size must be no more than 10% of its population size; not required for a randomized experiment
Randomization Condition
Independence: random sample from one population; homogeneity: independent random samples from the populations or data from a randomized experiment
