Topic 4.5 Notes – Measuring Public Opinion
What Scientific Polling Is
Public opinion means the combined attitudes and beliefs people hold about government and politics. Since you cannot ask everyone, pollsters survey a smaller group and use it to estimate what a larger group thinks.
A scientific poll uses a careful method. It is different from a straw poll, call-in survey, or random online click poll because those usually measure whoever chose to answer, not the public as a whole.
A credible poll includes:
- a clearly defined population. This is the whole group the poll is trying to describe.
- a sample that represents that population.
- neutral wording so the question itself does not push people.
- a reported margin of error.
- accurate reporting so the claim matches who was surveyed and what was asked.
The population matters a lot:
- All adults can include people who will not vote.
- Registered voters are narrower.
- Likely voters are narrower still.
- Actual voters means people who already voted, like in exit polls.
Those groups can give different results, so a poll of registered voters does not automatically tell you what all Americans think. Polls can shape campaigns, media coverage, and policy debates, but they measure opinion. They do not directly make policy.
Polling Methods That Make Results Credible
Good polling depends on getting the sample right before you ever look at the numbers.
Sampling and representation
A representative sample looks like the target population in politically relevant ways.
- Probability sampling means people in the population have a known chance of being selected.
- Simple random sample means everyone has an equal chance.
- Stratified random sample means pollsters divide people into groups, then randomly sample within each group so smaller groups are still represented.
- Weighting adjusts results after collection so the sample better matches the population. It can help with small imbalances, but it cannot rescue a badly flawed sample.
Sampling problems
- Selection bias happens when the process favors some people over others.
- Coverage bias happens when part of the population is left out.
- Voluntary-response bias happens when people choose to participate, so strong opinions get overrepresented.
- Nonresponse bias happens when selected people do not answer and they differ from those who do.
- Response bias happens when people give inaccurate answers or are influenced by the setting.
The classic warning story is the Literary Digest poll of 1936. It had a huge sample but bad sampling, and it wrongly predicted Alf Landon would beat FDR.
Margin of error
Even a good sample will not be perfect. Margin of error shows likely sampling uncertainty, usually at about the 95% confidence level.
This is the kind of range you should picture when you see a poll result reported with a plus-or-minus number.
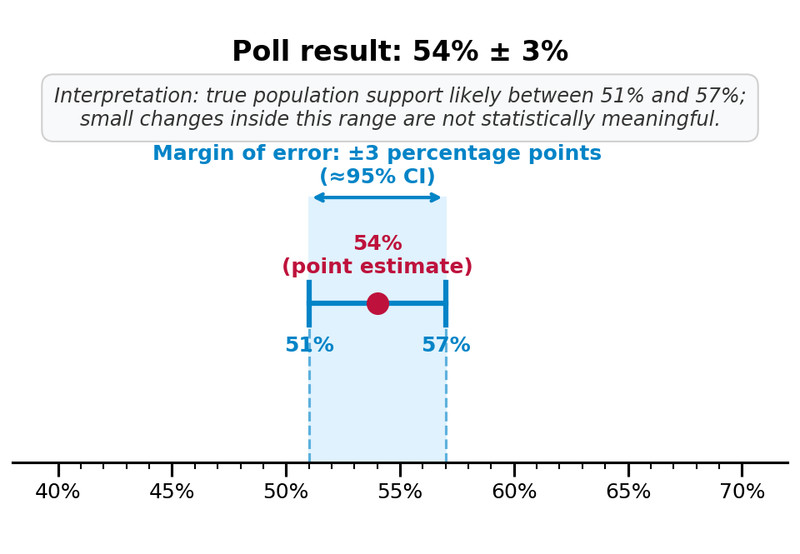
Poll result with margin of error
A larger sample usually lowers margin of error, but only if the sample is good. Margin of error applies to the full sample unless the poll says otherwise, so subgroup results are less precise. If two candidates’ ranges overlap, the race may be too close to call.
Question wording and framing
A strong sample can still produce weak data if the questions are bad.
- Questions should be neutral, clear, and specific.
- Leading or loaded questions push respondents toward an answer.
- Response choices should be balanced and may include unsure or no opinion.
- Question order can create priming or framing effects.
- A push poll is not real measurement. It pretends to be a poll but is actually persuasion.
Types of Scientific Polls
Different polls answer different political questions.
- Opinion polls measure views on candidates, institutions, issues, or policies. They are a snapshot of one moment.
- Benchmark polls happen early in a campaign. They establish baseline support, name recognition, and favorability.
- Tracking polls repeat over time with similar methods so you can see trends. Tiny changes inside the margin of error should not be overhyped.
- Exit polls survey people after they vote. They help explain who voted for whom and why, and they can help project winners, but they do not replace the official count.
The graph here is the kind of result you might see from a tracking poll. The main takeaway is the pattern over several date ranges, not any tiny shift from one period to the next.
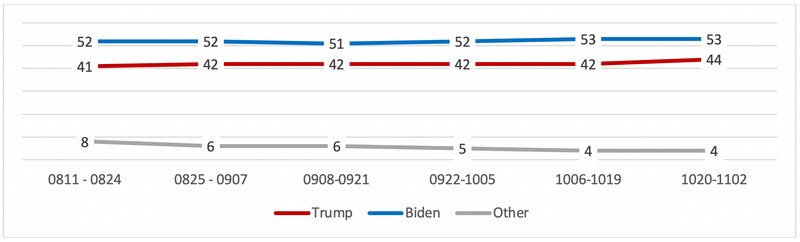
Tracking poll trend lines
How to Read and Report Polls Correctly
A poll result only means something if it is reported honestly. Good reporting identifies the sponsor, target population, sample size, selection method, dates, contact method, question wording, results, undecided voters, and margin of error.
Claims must match the evidence:
- A poll of registered voters cannot justify claims about all Americans.
- A poll taken before an event cannot measure reaction to that event.
- Correlation in poll data does not prove causation.
When you read graphs, check axes, labels, units, and scale. A pattern is a relationship in data at one time. A trend is movement over time.
Key Takeaways
Public Opinion
The aggregation of individuals’ attitudes and beliefs about political leaders, institutions, events, issues, and public policy
Scientific Poll
A systematic survey that identifies a target population, selects a representative sample, uses neutral questions, reports sampling uncertainty, and draws conclusions supported by the data
Population
The entire group about which a poll seeks to draw a conclusion
Sample
The smaller group whose responses a poll actually collects to estimate the views of a population
Representative Sample
A sample that resembles the target population in relevant respects without systematically including or excluding particular groups
Sampling Frame
The source or procedure used to identify and reach possible respondents
Probability Sample
A sample in which members of the target population have a known chance of selection
Simple Random Sample
A probability sample in which every member of the population has an equal chance of selection
Stratified Random Sample
A sample created by dividing the population into relevant categories and randomly selecting respondents within each category
Weighting
Statistically adjusting respondents’ influence so the completed sample better matches known characteristics of the population
Selection Bias
Bias caused when the selection process systematically makes some population members more likely to be included than others
Coverage Bias
Bias caused when the sampling frame excludes portions of the target population
Voluntary-Response Bias (Self-Selection Bias)
Bias caused when people choose whether to participate, often overrepresenting those with unusually strong views
Nonresponse Bias
Bias that occurs when selected people who do not participate differ meaningfully from those who respond
Response Bias
Bias that occurs when respondents give answers that do not reflect their actual views
Straw Poll
An unscientific poll, often an online click or call-in survey, whose self-selected respondents ordinarily cannot support conclusions about the general public
Sampling Error
The expected difference between a sample result and the population value because only part of the population was surveyed
Margin of Error
The likely range of sampling uncertainty around a poll estimate, usually stated in percentage points
Neutral Question Wording (Neutral Framing)
Specific, comprehensible, and unbiased wording that does not encourage a particular response
Leading Question (Loaded Question)
A question that encourages a particular answer by attaching favorable or unfavorable language to one position
Question-Order Effect (Framing or Priming Effect)
A change in responses caused by earlier questions influencing how respondents answer later questions
Push Poll
A campaign persuasion technique presented as a survey but designed to influence respondents with damaging or misleading information
Opinion Poll
A poll that measures a population’s views about candidates, institutions, events, or policy issues at a particular time
Benchmark Poll
An early-campaign poll that establishes baseline measures of a candidate’s support, recognition, favorability, and strengths or weaknesses
Tracking Poll
A poll that repeatedly uses comparable questions and methods to measure changes in candidate support during a campaign
Exit Poll
A survey of people who have voted that asks how and why they voted and often records demographic information
Accurate Reporting
Clearly disclosing a poll’s population, sample, methods, wording, dates, results, and uncertainty while drawing only conclusions the data support
Notes
Public Opinion
The aggregation of individuals’ attitudes and beliefs about political leaders, institutions, events, issues, and public policy
Scientific Poll
A systematic survey that identifies a target population, selects a representative sample, uses neutral questions, reports sampling uncertainty, and draws conclusions supported by the data
Population
The entire group about which a poll seeks to draw a conclusion
Sample
The smaller group whose responses a poll actually collects to estimate the views of a population
Representative Sample
A sample that resembles the target population in relevant respects without systematically including or excluding particular groups
Sampling Frame
The source or procedure used to identify and reach possible respondents
Probability Sample
A sample in which members of the target population have a known chance of selection
Simple Random Sample
A probability sample in which every member of the population has an equal chance of selection
Stratified Random Sample
A sample created by dividing the population into relevant categories and randomly selecting respondents within each category
Weighting
Statistically adjusting respondents’ influence so the completed sample better matches known characteristics of the population
Selection Bias
Bias caused when the selection process systematically makes some population members more likely to be included than others
Coverage Bias
Bias caused when the sampling frame excludes portions of the target population
Voluntary-Response Bias (Self-Selection Bias)
Bias caused when people choose whether to participate, often overrepresenting those with unusually strong views
Nonresponse Bias
Bias that occurs when selected people who do not participate differ meaningfully from those who respond
Response Bias
Bias that occurs when respondents give answers that do not reflect their actual views
Straw Poll
An unscientific poll, often an online click or call-in survey, whose self-selected respondents ordinarily cannot support conclusions about the general public
Sampling Error
The expected difference between a sample result and the population value because only part of the population was surveyed
Margin of Error
The likely range of sampling uncertainty around a poll estimate, usually stated in percentage points
Neutral Question Wording (Neutral Framing)
Specific, comprehensible, and unbiased wording that does not encourage a particular response
Leading Question (Loaded Question)
A question that encourages a particular answer by attaching favorable or unfavorable language to one position
Question-Order Effect (Framing or Priming Effect)
A change in responses caused by earlier questions influencing how respondents answer later questions
Push Poll
A campaign persuasion technique presented as a survey but designed to influence respondents with damaging or misleading information
Opinion Poll
A poll that measures a population’s views about candidates, institutions, events, or policy issues at a particular time
Benchmark Poll
An early-campaign poll that establishes baseline measures of a candidate’s support, recognition, favorability, and strengths or weaknesses
Tracking Poll
A poll that repeatedly uses comparable questions and methods to measure changes in candidate support during a campaign
Exit Poll
A survey of people who have voted that asks how and why they voted and often records demographic information
Accurate Reporting
Clearly disclosing a poll’s population, sample, methods, wording, dates, results, and uncertainty while drawing only conclusions the data support
