Topic 4.6 Notes – Evaluating Public Opinion Data
What Makes a Poll Credible
A poll only helps if the claim matches good evidence. You are judging two things at once.
- Reliability means the methods produce dependable results. If the sample is biased or the questions are slanted, the numbers are shaky even if they look precise.
- Veracity means the poll is reported honestly and the conclusion fits the data. A poll can be well run and still be used to make an exaggerated claim.
This connects back to scientific polling. Good polling uses a representative sample, neutral wording, and disclosed methods. A credible claim needs all of these working together:
- the correct target population for the claim
- a representative sample of that population
- neutral questions and procedures
- an honest statement of margin of error and limits
- a conclusion that stays inside the data
The exam loves this trap. Do not ask whether the poll “got it right” later. Ask whether the process and the inference were sound.
What to Check in the Poll Itself
Poll credibility starts with who the poll is actually about.
Population, sample, and sampling frame
- Population = the whole group the claim is about
- Sample = the people actually surveyed
- Sampling frame = the system used to reach those people
These must match the claim. A poll of all adults is different from registered voters or likely voters. In election polling, that difference is huge because only likely voters are close to the actual electorate.
Sample size and representativeness
- A larger sample lowers random sampling error.
- A biased sample stays bad even if it is enormous.
- About 1,000 properly chosen respondents can estimate national opinion pretty well.
- Be careful with subgroup claims. If the full sample is 1,000 but only 90 respondents are young independents, that subgroup result is much less certain.
Margin of error and uncertainty
A margin of error shows expected sampling uncertainty, usually at 95% confidence.
That is what a typical polling result looks like in practice.
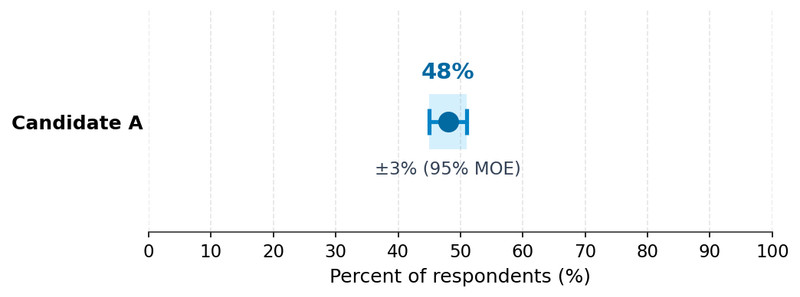
Poll result with a ±3% margin of error
If one candidate has 48% and another has 46% with similar margins of error, that “lead” may not mean much because the ranges overlap.
Margin of error only covers sampling error. It does not fix bad wording, turnout mistakes, or nonresponse bias.
Coverage, nonresponse, and self-selection
- Undercoverage happens when parts of the population are missed.
- Nonresponse happens when selected people do not answer. Bias appears if responders differ politically from nonresponders.
- Self-selection means people volunteer themselves, like online click polls or social media polls. Those are usually useless for representation.
- Weighting can adjust a sample, but it cannot fully rescue a badly skewed one.
How Poll Design Can Distort Results
Even a decent sample can be warped by the survey itself.
- Leading or loaded questions push people toward an answer.
- Ambiguous wording lets different people hear different questions.
- Double-barreled questions ask two things at once.
- Framing effects happen when different descriptions of the same issue change responses.
- Question order matters because earlier questions can prime later answers.
Mode matters too. Live phone, online, text, mail, and automated polls can get different answers. People often give more socially acceptable answers to a live interviewer.
Every poll is a snapshot of its field period. Late debates, scandals, crises, or turnout shifts can make an earlier accurate poll look wrong later. Exit polls avoid turnout prediction, but they still have sampling and nonresponse problems. Push polls are persuasion disguised as surveys, not real polling.
How to Interpret Poll Results and Claims
One poll is weaker than a pattern across multiple good polls.
- A single poll gives one estimate at one moment.
- A trend needs comparable polls over time and changes bigger than sampling error.
- A forecast predicts a future outcome. A poll measures current opinion.
Common bad reporting:
- calling a plurality a majority
- ignoring undecided voters
- acting like a narrow lead guarantees victory
- using national polls to predict the Electoral College
- claiming causation from ordinary polling data
Election examples you should know:
- Carter-Reagan 1980 shows timing matters because late movement changed the race.
- Obama-Romney 2012 shows state polling mattered more than isolated national horse-race polls.
- Clinton-Trump 2016 shows national polls were fairly close on the popular vote, but state-level errors hurt Electoral College forecasts.
Why Public Opinion Data Matter Politically
Polls shape behavior across politics.
- Campaigns use them to test messages, target groups, and spend money.
- Officials use them to judge support and electoral risk.
- Media use them to frame who is competitive and which issues matter.
Opinion matters most when it has:
- breadth = lots of people agree
- intensity = people feel strongly
- salience = the issue affects votes and action
- stability = the opinion lasts over time
A poll majority does not guarantee policy change. Institutions, parties, interest groups, turnout, and federalism all stand between opinion and action.
When drawing a political conclusion, move in this order:
- Identify what the poll measured.
- Judge whether the methods are credible.
- State only the conclusion the data support.
- Explain the likely political implication, if any.
Key Takeaways
Public Opinion
The distribution of citizens’ beliefs, attitudes, and preferences about political leaders, institutions, issues, and policies
Breadth of Public Opinion
How widely an opinion is shared across the public
Intensity of Public Opinion
The strength with which people hold an opinion
Issue Salience
The personal or political importance of an issue to an individual
Stability of Public Opinion
The degree to which an opinion persists over time rather than reflecting a temporary reaction
Reliability
The extent to which polling methods produce dependable measurements rather than results driven by chance or inconsistent procedures
Veracity
The extent to which reported polling results and conclusions truthfully and accurately represent the data
Transparency
Disclosure of a poll’s sponsor, population, sample, dates, mode, wording, margin of error, and adjustment procedures so its credibility can be evaluated
Population
The complete group about which a polling claim is made
Sample
The smaller group from which data are collected to draw an inference about a population
Sampling Frame
The practical list or system used to reach possible respondents from the target population
Representative Sample
A sample that sufficiently reflects the target population to support valid inferences about it
Random Selection vs. Random Assignment
Random selection chooses population members with known chances for sample inference; random assignment places subjects into experimental groups to identify causal effects
Likely-Voter Model
A pollster’s method for identifying which respondents are likely to vote and therefore should represent the expected electorate
Margin of Error
An estimate of how far a sample result may differ from the population value because only a sample was surveyed
95 Percent Confidence Level
The convention that repeated sampling would produce intervals containing the true population value approximately 95 percent of the time
Undercoverage
The absence or inadequate representation of part of the target population in the sampling frame
Nonresponse
The failure to obtain answers from selected people because they cannot be contacted or decline to participate
Nonresponse Bias
Distortion that occurs when people who respond differ politically from selected people who do not respond
Self-Selection or Voluntary-Response Bias
Distortion caused when people choose themselves for a survey, often overrepresenting those with unusually strong interest or motivation
Weighting
Adjusting respondents’ influence so a sample more closely matches known population characteristics
Leading or Loaded Question
A survey question whose wording encourages a particular response or embeds favorable or unfavorable judgments
Ambiguous Question
A survey question containing unclear terms that respondents may interpret differently
Double-Barreled Question
A survey question that asks about more than one matter while allowing only one response
Framing Effect
A change in responses caused by presenting the same basic issue through different accurate descriptions
Question-Order Effect
A change in responses caused by earlier survey questions influencing answers to later questions
Push Poll
A survey-like effort that delivers favorable or damaging information to influence respondents rather than genuinely measure opinion
Survey Mode
The method used to conduct a survey, such as live telephone, automated call, text, mail, or online panel
Interviewer Effect
A change in survey answers caused by a respondent’s interaction with an interviewer
Social-Desirability Effect
The tendency to report a socially acceptable answer rather than one’s actual view, especially on sensitive issues
Exit Poll
A survey conducted with voters after they vote to estimate how different groups voted and why
Plurality vs. Majority
A plurality is the largest share even if below 50 percent; a majority is more than 50 percent
Poll Aggregation
Combining multiple independent polls to reduce the effect of unusual samples and identify the broader direction of opinion
Trend
A sustained pattern across comparable polls over time rather than a difference between only two sample estimates
Poll vs. Forecast
A poll estimates current opinion in a specified population; a forecast combines polls with assumptions or other evidence to estimate a future outcome
Notes
Public Opinion
The distribution of citizens’ beliefs, attitudes, and preferences about political leaders, institutions, issues, and policies
Breadth of Public Opinion
How widely an opinion is shared across the public
Intensity of Public Opinion
The strength with which people hold an opinion
Issue Salience
The personal or political importance of an issue to an individual
Stability of Public Opinion
The degree to which an opinion persists over time rather than reflecting a temporary reaction
Reliability
The extent to which polling methods produce dependable measurements rather than results driven by chance or inconsistent procedures
Veracity
The extent to which reported polling results and conclusions truthfully and accurately represent the data
Transparency
Disclosure of a poll’s sponsor, population, sample, dates, mode, wording, margin of error, and adjustment procedures so its credibility can be evaluated
Population
The complete group about which a polling claim is made
Sample
The smaller group from which data are collected to draw an inference about a population
Sampling Frame
The practical list or system used to reach possible respondents from the target population
Representative Sample
A sample that sufficiently reflects the target population to support valid inferences about it
Random Selection vs. Random Assignment
Random selection chooses population members with known chances for sample inference; random assignment places subjects into experimental groups to identify causal effects
Likely-Voter Model
A pollster’s method for identifying which respondents are likely to vote and therefore should represent the expected electorate
Margin of Error
An estimate of how far a sample result may differ from the population value because only a sample was surveyed
95 Percent Confidence Level
The convention that repeated sampling would produce intervals containing the true population value approximately 95 percent of the time
Undercoverage
The absence or inadequate representation of part of the target population in the sampling frame
Nonresponse
The failure to obtain answers from selected people because they cannot be contacted or decline to participate
Nonresponse Bias
Distortion that occurs when people who respond differ politically from selected people who do not respond
Self-Selection or Voluntary-Response Bias
Distortion caused when people choose themselves for a survey, often overrepresenting those with unusually strong interest or motivation
Weighting
Adjusting respondents’ influence so a sample more closely matches known population characteristics
Leading or Loaded Question
A survey question whose wording encourages a particular response or embeds favorable or unfavorable judgments
Ambiguous Question
A survey question containing unclear terms that respondents may interpret differently
Double-Barreled Question
A survey question that asks about more than one matter while allowing only one response
Framing Effect
A change in responses caused by presenting the same basic issue through different accurate descriptions
Question-Order Effect
A change in responses caused by earlier survey questions influencing answers to later questions
Push Poll
A survey-like effort that delivers favorable or damaging information to influence respondents rather than genuinely measure opinion
Survey Mode
The method used to conduct a survey, such as live telephone, automated call, text, mail, or online panel
Interviewer Effect
A change in survey answers caused by a respondent’s interaction with an interviewer
Social-Desirability Effect
The tendency to report a socially acceptable answer rather than one’s actual view, especially on sensitive issues
Exit Poll
A survey conducted with voters after they vote to estimate how different groups voted and why
Plurality vs. Majority
A plurality is the largest share even if below 50 percent; a majority is more than 50 percent
Poll Aggregation
Combining multiple independent polls to reduce the effect of unusual samples and identify the broader direction of opinion
Trend
A sustained pattern across comparable polls over time rather than a difference between only two sample estimates
Poll vs. Forecast
A poll estimates current opinion in a specified population; a forecast combines polls with assumptions or other evidence to estimate a future outcome
