Topic 1.3 Notes – Estimating Limit Values from Graphs
1. What a Limit Is From a Graph
When you see
it means:
As x gets close to a, the y-values get close to L.
It does not mean .
From a graph, you ignore the exact value at and look at what the graph is doing nearby.
One-Sided Limits
Sometimes the graph behaves differently from each side.
- Left-hand limit:
Approach from values less than a (move rightward toward a). - Right-hand limit:
Approach from values greater than a (move leftward toward a).
The two-sided limit exists only if:
If those don’t match, the limit is DNE.
Important: the limit can exist even if
- There’s a hole at
- The function isn’t defined there
- The filled dot is at a totally different height
The graph’s approach is what matters.
2. Estimating a Limit From a Graph
When this shows up on a quiz or no-calculator MCQ, they want you to read behavior carefully.
Here’s the process in your head:
- Find the x-value you’re approaching.
- Trace from the left. What y-value are you getting close to?
- Trace from the right. What y-value are you getting close to?
- Compare.
- Same number → that’s the limit.
- Different numbers → DNE.
- Growing without bound → infinite behavior (also DNE as a finite number).
Common Graph Situations
Here are three patterns you’ll see over and over:
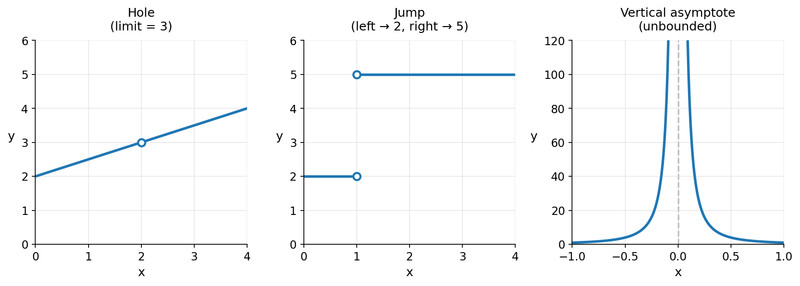
Hole, jump discontinuity, and vertical asymptote
Interpret them like this:
- Hole (open circle) → limit usually exists because both sides approach the same y-value.
- Jump → left and right limits differ → DNE.
- Vertical asymptote → function is unbounded near that x-value.
And if there’s a filled dot somewhere else? Ignore it for the limit.
One mistake I see constantly: students read the filled dot instead of the approaching value. That costs easy points.
3. When a Limit Does Not Exist
There are exactly three patterns you need to recognize.
1. Left and Right Don’t Match (Jump)
Example shape:
- From the left, graph approaches 4.
- From the right, graph approaches −1.
Since 4 ≠ −1, the limit DNE.
A classic algebra example is
Left side gives −1, right side gives 1. No agreement.
2. Unbounded Behavior (Infinite)
If the function shoots upward or downward near a value, it’s unbounded.
Examples:
Even if both sides go to , the limit does not exist as a finite number.
On FRQs, writing “approaches infinity” is fine to describe behavior, but technically the limit DNE.
3. Oscillation
Some functions never settle.
Example:
Near 0, the graph keeps bouncing between −1 and 1 faster and faster.
It never locks in on a single value as approaches 0.
Since it never approaches one number, the limit DNE.
4. Graph Scale and Hidden Behavior
Graphs can lie to you.
Scale Issues
If the window is too wide:
- A vertical asymptote might look like a point.
- Oscillation might look like a blur.
- A tiny jump might look continuous.
AP exam graphs are usually trustworthy, but you still read them carefully.
If algebra suggests something weird could happen, don’t blindly trust a smooth-looking picture.
Especially on calculator sections, window settings can hide behavior. Zooming mentally near the x-value matters.
5. Common Mistakes
- Confusing with
- Checking only one side
- Calling infinity a number
- Looking at the point instead of the approach
- Deciding from far away instead of zooming in near
When you answer, always think:
Left?
Right?
Same?
Finite?
That logic is what graders look for on written responses.
