Topic 5.8 Notes – Sketching Graphs of Functions and Their Derivatives
How Derivatives Determine the Shape of a Graph
Think of it in layers:
- → position (the graph itself)
- → slope of the graph
- → how the slope is changing
From that, almost everything follows.
What tells you
- If , the function is increasing.
- If , the function is decreasing.
- If or undefined (and exists), that’s a critical point.
- If changes sign:
- → local maximum
- → local minimum
What tells you
- If , the graph is concave up (cup shape).
- If , the graph is concave down (cap shape).
- If changes sign → point of inflection.
Here’s how those ideas connect between a function and its derivative. In the diagrams, notice how the turning points of the original graph line up with where the derivative crosses the x-axis, and how positive and negative regions of match increasing and decreasing behavior.
On AP questions, you’re often asked to justify conclusions using this logic, not just state them.
The Complete Graph Sketching Checklist
When you’re given a formula for , build the graph in a logical order.
1. Domain and Continuity
- Polynomials → domain is all real numbers.
- Rational functions → denominator cannot be zero.
- Check for holes or vertical asymptotes.
If the function isn’t defined somewhere, that affects everything else.
2. Intercepts and Symmetry
- x-intercepts solve .
- y-intercept compute .
- Even symmetry:
- Odd symmetry:
These give anchor points before calculus even starts.
3. Critical Points from
- Find .
- Solve .
- Include where is undefined but exists.
These x-values divide the graph into intervals for sign testing.
4. Increasing and Decreasing
Pick a test value in each interval between critical points.
- If → increasing
- If → decreasing
That sign change classifies extrema automatically.
5. Concavity and Inflection Points
- Find .
- Solve or undefined.
- Test signs on either side.
No sign change means no inflection point, even if . That’s a common trap.
First vs Second Derivative Tests
You have two ways to classify extrema.
First Derivative Test
Look at the sign change of .
- Works every time if signs are clear.
- Especially useful on FRQs where you must justify behavior.
Second Derivative Test
At a critical point where :
- → local minimum
- → local maximum
- → inconclusive
Faster, but only works if .
Reading Information from Graphs of and
This shows up constantly on quizzes and the AP exam.
If you’re given the graph of
When you’re handed a graph of , your job is to translate what you see into behavior of .
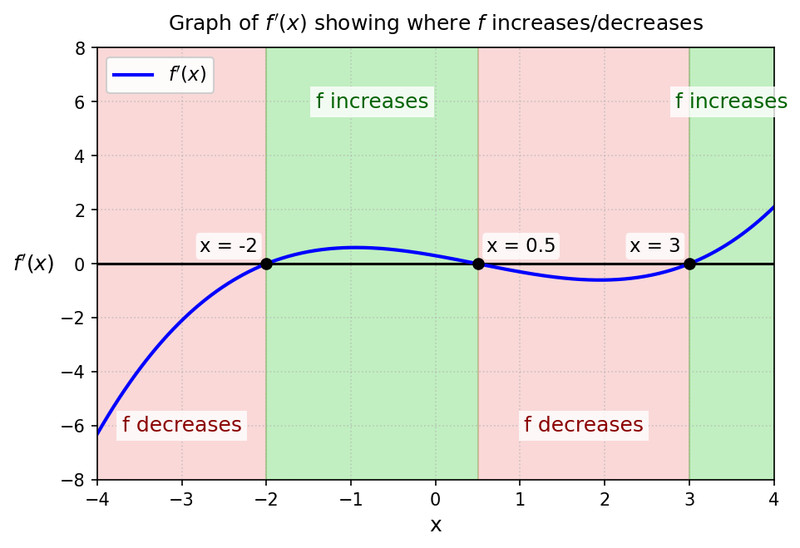
From a graph like this:
- Where is above the x-axis → increasing.
- Where below → decreasing.
- Where crosses the axis → possible extrema of .
- If it just touches and turns around → horizontal tangent, not necessarily an extremum.
Students often confuse where with where . Totally different ideas.
If you’re given the graph of
- Above x-axis → concave up.
- Below x-axis → concave down.
- Sign change → inflection point.
Remember, inflection requires a sign change, not just touching zero.
Connecting All Representations
AP questions love mixing representations:
- Analytical: formulas for , ,
- Numerical: tables of values for
- Graphical: graphs of or
You should be able to move between them smoothly.
Example from a table:
If a table shows changing from negative to positive at , you can justify that has a local minimum at . That justification language matters on FRQs.
