Topic 6.5 Notes – Interpreting the Behavior of Accumulation Functions Involving Area
What an Accumulation Function Is
An accumulation function has the form
Here’s what that means:
- It represents the signed area under from to .
- The lower limit is constant.
- The upper limit is the variable.
By the Fundamental Theorem of Calculus,
So the function you’re given inside the integral, , is actually the derivative of .
That idea drives everything.
Visualizing Accumulation
Here’s what that definition looks like geometrically. In the graph below, the red curve represents , and measures the accumulated signed area from the fixed point to the moving point .
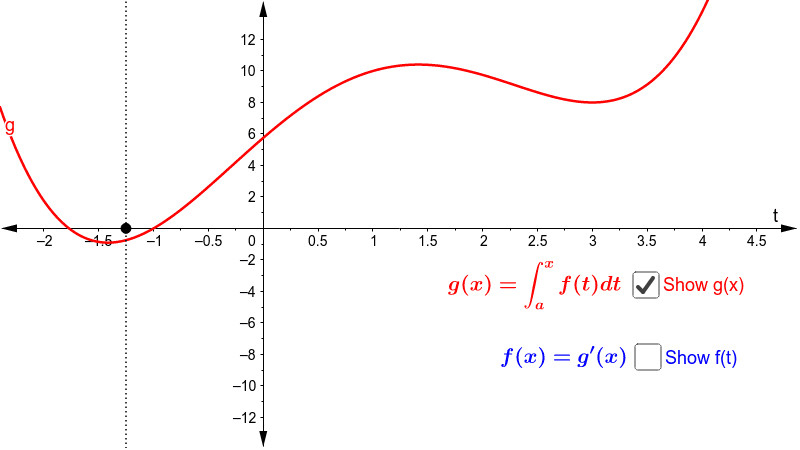
Accumulation function
As moves to the right, more area is added, or subtracted if the graph is below the axis. That changing total area is the value of .
How Behavior of g Comes From f
Since , the graph of tells you everything about the behavior of .
Increasing and Decreasing
- If , then → is increasing.
- If , then is decreasing.
- If , that’s a critical point of .
You are reading the graph of as if it were the derivative of another function.
Relative Max and Min
Relative extrema occur where:
- , and
- changes sign.
Sign change patterns:
- → relative maximum of
- → relative minimum of
Just like first derivative tests, except the derivative is already given to you.
Concavity
Since , concavity depends on whether is increasing or decreasing.
- If is increasing → is concave up.
- If is decreasing → is concave down.
So now you’re analyzing the slope of the graph of .
Points of Inflection
Inflection points of occur where:
- changes sign
- meaning changes sign
- meaning the slope of changes from positive to negative or vice versa.
Important trap:
A point where is not automatically an inflection point. The slope of must change sign.
Using Area to Find Function Values
Sometimes you’re told a value like and given a graph of . You use:
The integral gives net change.
- Area above the x-axis → positive change
- Area below the x-axis → negative change
On tests, the graph often forms geometric shapes. For example:
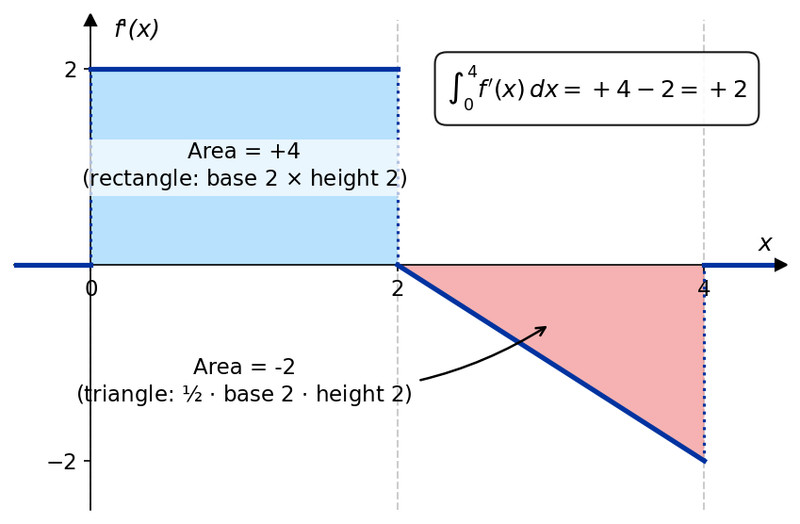
Geometric areas on a graph of
From to , the rectangle gives . From to , the triangle gives . The net change is .
Break regions into rectangles, triangles, semicircles, etc. Keep signs correct. If you reverse bounds, the sign flips.
A clean setup that earns full credit on FRQs looks like:
Students lose points by skipping that equation line.
Graph, Table, and Equation Representations
You’ll see accumulation functions represented in three main ways.
1. Graph of
- Treat the graph as .
- Use sign for increasing/decreasing.
- Use slope for concavity.
- Use geometry for values.
This is extremely common on non-calculator FRQs.
2. Table of Values
If a table gives :
- That’s .
- Signs determine behavior.
If it gives :
- That controls concavity of .
Always pause and ask yourself:
“What level of derivative am I looking at?”
3. Equation
Example:
Then:
- Since , is increasing everywhere.
- , so concavity depends on sign of .
When it’s algebraic like this, you analyze normally after taking the derivative.
