Topic 1.4 Notes – Estimating Limit Values from Tables
1. What It Means to Estimate a Limit from a Table
A limit describes the value a function approaches as approaches some number .
This means: as gets close to , the outputs get close to .
Two reminders that matter a lot on tests:
- The limit depends on values near , not necessarily at .
- might be different from the limit - or undefined - and the limit can still exist.
When you’re estimating from a table:
- You look at -values very close to .
- You check what the corresponding -values are doing.
- You decide what number those outputs are trending toward.
You’re not looking for equality. You’re looking for behavior.
This often shows up when direct substitution would give something like , or when you’re only given numerical data instead of a formula.
2. One-Sided Limits
When estimating from a table, you almost always need to think about both sides of .
Left-hand limit
- values less than
- Moving toward from the left
Right-hand limit
- values greater than
- Moving toward from the right
Here’s the rule you need to know cold:
If the two sides:
- ✔️ Approach the same number → the limit exists.
- ❌ Approach different numbers → the limit does not exist.
- ❌ Grow without bound ( or ) → infinite limit (vertical asymptote behavior).
On multiple-choice questions, they love hiding a mismatch between left and right in small decimal differences. Always check both sides.
3. How to Estimate from a Table
Let’s say you’re given a table near .
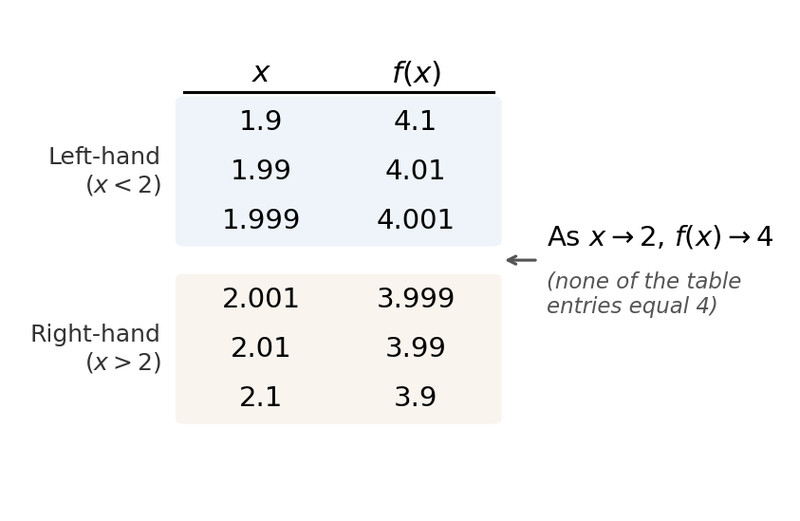
Table of values approaching from both sides
This is exactly the kind of setup you’ll see on multiple choice and FRQs.
Here’s how to read it.
1. Identify the target
The limit is as .
2. Separate left and right
- Left side: 1.9, 1.99, 1.999
- Right side: 2.001, 2.01, 2.1
3. Look for a pattern
From the left, outputs: 4.1 → 4.01 → 4.001
From the right, outputs: 3.9 → 3.99 → 3.999
Both sides are getting closer to 4.
So,
Notice something important: none of the outputs actually equal 4. That does not matter. The limit is about approach.
On FRQs, if they say “estimate,” give a reasonable decimal and justify it by referencing both sides.
4. Recognizing Different Behaviors
Tables can show different limit situations. You need to recognize these patterns quickly.
Removable Discontinuity (Hole)
- Table values approach a finite number.
- The function might be undefined at that point.
- Limit exists.
This is common when substitution gives .
Jump Discontinuity
- Left side approaches one number.
- Right side approaches a different number.
- Limit does not exist.
If a table showed left approaching 3 and right approaching 5, that’s immediately DNE.
Vertical Asymptote
- Values grow very large positive or negative.
- Outputs trend toward .
That means an infinite limit.
No Clear Pattern
If values bounce around and don’t settle toward anything, the limit does not exist.
