Topic 6.1 Notes – Exploring Accumulations of Change
Accumulation of Change from a Rate Function
Suppose is a rate of change. That means it tells you how fast something is changing at time .
The big idea:
represents the net accumulated change in the original quantity from to .
Think of it in three connected ways:
- Algebraically: integral of a rate = total change
- Geometrically: area between the graph of and the x-axis
- Conceptually: rate × time = accumulated amount
If velocity is the rate, the integral gives displacement.
If water flows at a rate, the integral gives total water added.
If population grows at a rate, the integral gives total population change.
This is the core of Unit 6.
What the Area Represents in Context
Here’s a simple picture to anchor this idea. The graph shows a rate function that is above the axis from to , then below the axis from to .
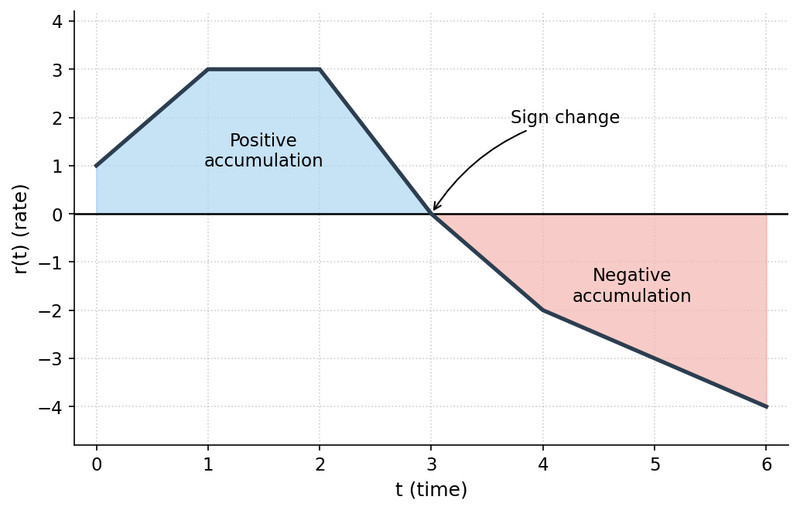
Signed area under a rate function
Signed Accumulation Means Net Change
The definite integral gives net change, not “total amount” unless the rate is always positive.
- If , the area is positive → the quantity increases.
- If , the area is negative → the quantity decreases.
- Total net change = positive area − negative area.
In the picture, the shaded region above the axis represents positive accumulation, and the shaded region below represents negative accumulation. The integral from to would combine both to give the overall change.
On quizzes, this shows up when velocity goes below the axis. The integral gives displacement, not total distance traveled. If they want total distance, you’d need absolute value. Students lose points here every year.
Always ask yourself: is the graph above or below the axis?
Units of Accumulation
Units multiply. Every time.
Examples:
- meters/second × seconds = meters
- gallons/hour × hours = gallons
- dollars/day × days = dollars
If your final answer still has “per” in it, something went wrong. AP graders check units on FRQs.
Finding Accumulation from a Graph Using Geometry
If the graph is made of straight lines, you can compute area exactly using geometry.
Common formulas you’ll use:
- Rectangle:
- Triangle:
- Trapezoid:
Typical process:
- Break the region into simple shapes.
- Compute each area.
- Assign a negative sign if the region is below the axis.
- Add everything.
If part of the region is below the axis, that area subtracts. Don’t just add absolute values unless the question says “total amount accumulated.”
On the AP exam, this often appears in calculator-active questions where you’re interpreting a piecewise linear rate graph.
Riemann Sums as Approximation of Accumulation
When the shape isn’t nice and geometric, we approximate.
A Riemann sum adds up rectangle areas:
- = width of each subinterval
- = height (value of the rate at a chosen point)
Here’s what that looks like visually using right endpoints.
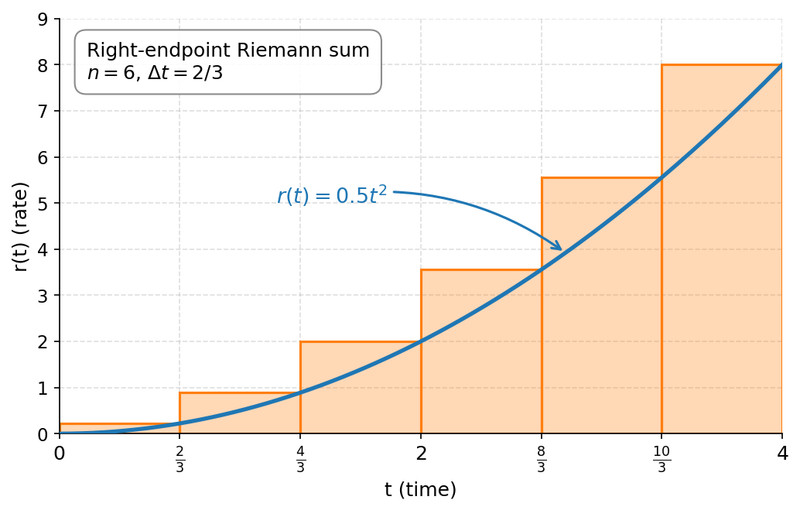
Right-endpoint Riemann sum with 6 rectangles
Each rectangle’s height comes from the value of at the right edge of the subinterval, which is why several rectangles overshoot the curve.
Conceptually:
- Divide the interval.
- Build rectangles.
- Add their areas.
- More rectangles → better approximation.
The definite integral is what you get when those rectangles become infinitely thin. You don’t compute that limit yet in this topic, but that’s where it’s going.
How This Connects to Derivatives
Earlier units:
Derivative → instantaneous rate of change.
Now:
Integral of that rate → total accumulated change.
They undo each other. That relationship becomes formal in the Fundamental Theorem of Calculus later in Unit 6.
For now, lock in the meaning: area under a rate curve equals accumulation.
