Topic 1.9 Notes – Connecting Multiple Representations of Limits
What a Limit Means Across Representations
When you see it means as gets arbitrarily close to , the function values get arbitrarily close to .
Two things matter:
- What happens near
- Behavior from both sides
The limit exists only if:
- and both exist
- They are equal
- They approach the same finite value (unless you’re dealing with infinite limits)
Also remember:
- The limit does not depend on .
- can be different from the limit, or undefined, and the limit can still exist.
That idea has to stay consistent whether you're looking at a graph, a table, or an equation.
Graphical Representation
Here’s what you’re scanning for on a graph. This example shows a removable discontinuity at .
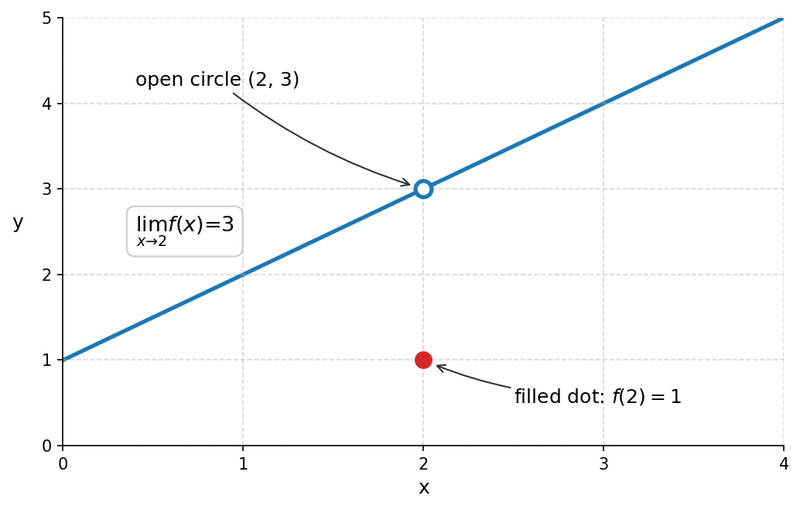
Removable discontinuity at
From this graph:
- As , the curve approaches from both sides.
- There’s a hole at .
- The filled dot at shows .
So:
Key patterns to recognize:
- Same height from left and right → limit exists.
- Different heights → limit does not exist (jump).
- Vertical asymptote → limit may be , , or DNE.
On multiple-choice questions, they love giving you a filled point that tries to distract you. Ignore it. Track the approaching behavior.
Numerical Representation
Tables show you values close to , not at .
Suppose you’re given:
| 1.9 | 1.99 | 2.01 | 2.1 | |
|---|---|---|---|---|
| 2.8 | 2.98 | 3.02 | 3.2 |
You’re looking for:
- Left side (less than 2)
- Right side (greater than 2)
Both sides are approaching 3. So the table suggests:
What to watch for:
- Values stabilizing toward one number → limit likely exists.
- Left and right approaching different numbers → DNE.
- Values getting very large positive/negative → infinite limit.
On calculator-active questions, tables often give strong clues, but make sure both sides agree.
Algebraic Representation
With equations, your job is to simplify first, then evaluate.
If direct substitution works, you’re done.
If you get , that signals a removable discontinuity. Factor and cancel.
Example:
Factor:
Cancel:
Now substitute:
So the limit is 4.
Important connection:
- If something cancels → hole in the graph.
- If denominator goes to 0 and doesn’t cancel → vertical asymptote.
You should automatically picture the graph when you simplify algebra.
Connecting All Three
On quizzes and the AP exam, you’ll often see something like:
“Which of the following could represent a function where ?”
Treat each choice separately:
- Determine the limit from that representation.
- Check both sides.
- Ignore the function value at .
- Compare to the given limit.
Discontinuity patterns across forms:
- Removable (hole)
- Graph: open circle
- Algebra: factor cancels
- Table: smooth approach
- Limit exists
- Jump
- Graph: step
- Table: two different approaching values
- Piecewise function with unequal side behavior
- Limit does not exist
- Infinite
- Graph: vertical asymptote
- Algebra: denominator → 0, no cancellation
- Table: exploding values
If the representations don’t tell the same story near , they don’t match.
