Topic 2.3 Notes – Estimating Derivatives of a Function at a Point
1. What the Derivative at a Point Represents
When you see , think:
- Instantaneous rate of change of when
- Slope of the tangent line to the graph at
It comes from this limit definition:
That fraction is the average rate of change over a small interval. As , that average rate becomes the instantaneous rate.
Here’s what that looks like visually.
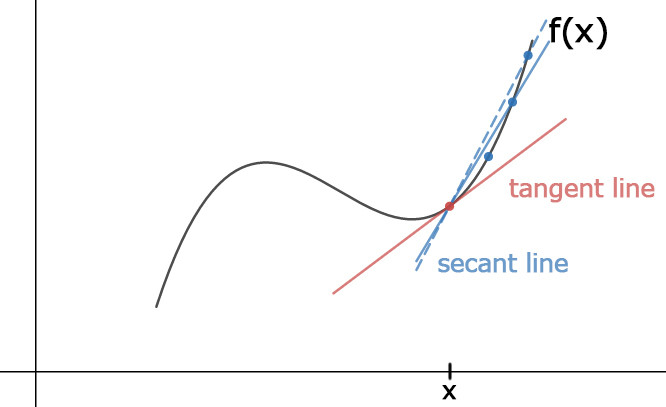
Secant lines approaching a tangent line
The blue secant lines use nearby points to compute average rates of change. As those points move closer together, the secant line approaches the red tangent line, and its slope approaches .
Key meanings you should recognize immediately:
- → function increasing at
- → function decreasing
- Large magnitude → steep tangent line
- Units of = (units of output) per (units of input)
If the function is height in meters and time in seconds, then the derivative is meters per second. Always attach units on FRQs.
2. Estimating from a Table of Values
If you’re given a table and asked to estimate , you’re approximating slope using nearby points.
Best Case: Symmetric Difference
If values exist on both sides of and are equally spaced:
This is usually more accurate because it uses information from both sides.
Example idea (numbers will vary on your test):
If you want and the table gives values at 2.9 and 3.1:
That denominator is .
If Symmetric Points Aren’t Available
Use a one-sided estimate:
- Forward difference:
- Backward difference:
Use whichever data is closest.
What AP Readers Expect
When it’s a context problem:
- A numerical estimate
- Correct units
- Interpretation in a sentence
For example:
“At minutes, the amount of water is increasing at approximately 2.3 liters per minute.”
Students often lose points by:
- Using points far away
- Forgetting to divide by the correct change in
- Leaving off units
3. Estimating from a Graph
When you’re given a graph, you are estimating the slope of the tangent line.
That means:
- Visualize or lightly sketch the tangent line.
- Pick two clear points on that line.
- Compute slope = rise/run.
Here’s what that looks like.
In the graph above, focus on the red tangent line at the marked point. Your job is to estimate its slope using two convenient points on that red line.
Important reminders:
- Use points on the tangent line, not the curve.
- Check axis scale before calculating slope.
- If the graph is flattening out → derivative near 0.
- If it’s sharply rising → large positive derivative.
A classic multiple-choice trap is picking two points on the curve instead of the tangent line.
4. Using Technology to Estimate a Derivative
On calculator sections, you may be asked to find a numerical derivative.
Graphing Calculator
Most have a “numerical derivative at a point” feature.
Make sure:
- You’re in radian mode for trig functions.
- You evaluate at the correct -value.
Desmos
Define your function:
f(x) = ...
Then type:
f'(a)
You’ll get a decimal approximation.
Technology is especially helpful when:
- The function is messy
- You’re told to use a calculator
- The derivative would be long to compute by hand
Still sanity-check the sign. If the graph is decreasing, your answer should be negative.
5. Common Mistakes
- Confusing average rate of change over an interval with instantaneous rate at a point.
- Forgetting symmetric difference when possible.
- Choosing points too far from the target value.
- Ignoring units in context questions.
- Getting the wrong sign because you didn’t check whether the graph increases or decreases.
Before moving on, mentally check: does my answer make sense based on the behavior of the function?
