Topic 5.4 Notes – Using the First Derivative Test to Determine Relative (Local) Extrema
1. What the First Derivative Test Says About Local Extrema
Everything starts with a critical point.
A critical point happens where:
- , or
- is undefined (and exists there).
Now remember what the derivative tells you:
- → function is increasing
- → function is decreasing
The First Derivative Test uses this idea:
- If changes positive → negative, the function goes increasing → decreasing → local maximum
- If changes negative → positive, the function goes decreasing → increasing → local minimum
- If does not change sign, there is no local extremum
Think in motion:
- Climbing then descending = hill (max)
- Descending then climbing = valley (min)
Here’s what that sign change looks like on a sign chart:
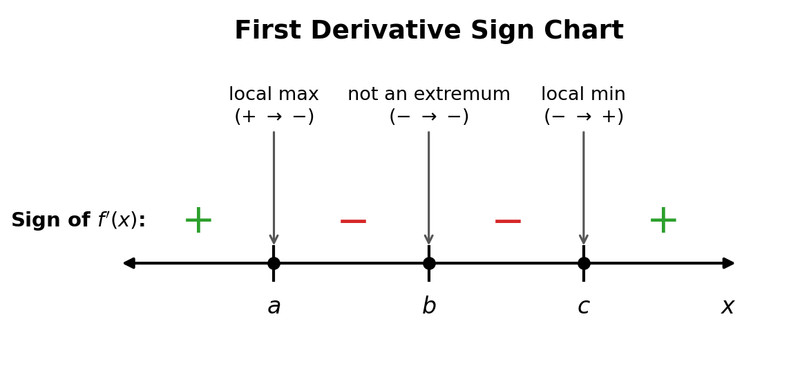
First Derivative sign chart
At point a, the sign changes from positive to negative, so there is a local maximum. At b, the sign stays negative on both sides, so there is no extremum. At c, the sign changes from negative to positive, so there is a local minimum.
Notice that what matters is the sign change, not just whether .
2. The Full Classification at a Critical Point
At any critical point, only four things can happen:
| Sign of | Function Behavior | Classification |
|---|---|---|
| Increasing → Decreasing | Relative maximum | |
| Decreasing → Increasing | Relative minimum | |
| Increasing both sides | Not an extremum | |
| Decreasing both sides | Not an extremum |
On tests, you are not guessing from the graph. You are justifying using derivative behavior.
A correct AP-style sentence sounds like:
Since changes from negative to positive at , has a relative minimum at .
That explanation earns the point.
3. How to Apply the First Derivative Test
Let’s walk through the process cleanly.
Step 1: Differentiate
Find .
Step 2: Find Critical Points
Solve:
- Where is undefined (but is defined)
These are the only possible locations of local extrema.
Step 3: Create a Sign Chart
Place critical points on a number line.
Then:
- Either plug in test values
- Or analyze signs from factored form
For example, if
Critical points: ,
Test intervals:
- Left of −3 → both factors negative → positive
- Between −3 and 1 → one positive, one negative → negative
- Right of 1 → both positive → positive
Sign pattern:
So:
- : → local max
- : → local min
That full reasoning is what earns FRQ credit.
4. Patterns That Show Up Often on Tests
Factored derivatives
When is already factored, use sign logic instead of plugging numbers. It’s faster and cleaner.
Repeated factors (multiplicity)
If
The squared factor has even multiplicity, so its sign does not change.
Rule:
- Even power → no sign change
- Odd power → sign changes
This lets you classify points quickly without test values.
When a graph of is given
Very common on AP exams. Instead of an equation, you get the graph of and must decide what is doing.
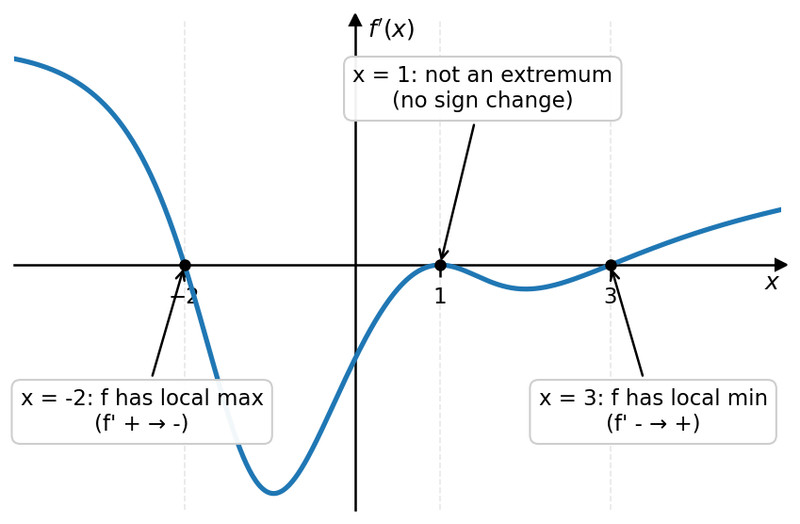
Graph of showing sign changes
Notice in the graph above:
- At , crosses from positive to negative → local maximum of
- At , touches 0 but does not change sign → not an extremum
- At , crosses from negative to positive → local minimum of
You are analyzing sign change, not height of the graph.
5. Common Mistakes That Cost Points
- Saying “, so there’s a max/min.” That is incomplete. You must show a sign change.
- Checking only one side of the critical point.
- Mixing up max and min. If you forget, picture walking along the graph.
- Forgetting this only gives local extrema. Absolute extrema require checking endpoints on closed intervals.
The entire idea of this topic is simple but powerful:
The behavior of the derivative determines the behavior of the function.
