Topic 7.6 Notes – Evidence of Evolution
1. Evolution Is Supported by Multiple Independent Lines of Evidence
Evolution means populations change over time, and all organisms share common ancestors. What makes the case so strong is that geology, anatomy, genetics, and math all independently support that idea.
Five Major Categories of Evidence
a. Geological data
- Rock layers (strata) form over time. Deeper layers are older.
- Fossils appear in a consistent order worldwide.
- Major geological events such as climate shifts and mass extinctions line up with evolutionary changes in organisms.
When species disappear in the rock record and new forms appear afterward, that pattern matches evolutionary predictions.
b. Fossil record
- Fossils are preserved remains or traces of organisms.
- They show species appearing, changing, and going extinct.
- Transitional forms connect major groups.
If species were created independently and never changed, fossils would appear randomly. They don’t.
c. Morphological (anatomical) evidence
- Homologous structures
- Vestigial structures
- Comparative embryology
All of these show structural similarities that are best explained by shared ancestry.
d. Biochemical and genetic evidence
- DNA sequence comparisons
- Protein (amino acid) comparisons
- Universal genetic code
The closer the DNA match, the more recent the common ancestor.
e. Mathematical and population genetics models
- Hardy-Weinberg equilibrium predicts when evolution is not occurring.
- Models track allele frequency changes over time.
- Statistical phylogenetics infers evolutionary relationships.
When math, fossils, and DNA all support the same branching pattern, that convergence is powerful.
2. Fossils and How We Date Them
Fossils show that organisms in the past were different from organisms today. Dating methods tell us when they lived.
Relative Dating and Stratigraphy
The law of superposition states that lower rock layers are older than layers above them.
- Fossils in deeper layers are older.
- This gives relative age, not exact years.
- Fossil sequences are consistent across continents.
This is why dinosaurs never appear above mammals in undisturbed rock layers.
Absolute Dating and Radiometric Methods
Radiometric dating uses predictable radioactive decay.
Each isotope has a half-life, the time required for half of it to decay.
Carbon-14 (C-14)
- Used for recent organic material
- Effective up to about 50,000 years
Other isotopes for older material
- Potassium-40 → Argon-40
- Uranium-238 → Lead-206
These allow scientists to assign actual ages to rocks and fossils.
On exams, you may see a decay graph and need to interpret how many half-lives have passed. Just count the halving pattern.
3. Morphological Evidence of Common Ancestry
Structural similarities tell a story of modification over time.
Homologous vs. Analogous Structures
| Feature | Homologous Structures | Analogous Structures |
|---|---|---|
| Underlying structure | Same basic anatomy | Different anatomy |
| Function | May differ | Similar function |
| Evolutionary meaning | Common ancestry | Convergent evolution |
| Example | Human arm, bat wing, whale flipper | Bird wing and insect wing |
Homologous structures are especially important. In vertebrate forelimbs, the same set of bones appears again and again, even though the limbs perform very different functions.

Homologous forelimbs in mammals
Notice that the humerus, radius, ulna, carpals, metacarpals, and phalanges are present in the human, cat, whale, and bat. Same bones. Different functions. That pattern supports descent with modification.
Vestigial Structures
These are reduced remnants of ancestral features.
Examples:
- Whale pelvic bones
- Human coccyx (tailbone)
- Wings in flightless birds
They make sense under evolution because ancestors used them fully.
Comparative Embryology
Early embryos of related organisms often look similar. Shared developmental genes suggest shared ancestry.
4. Molecular and Genetic Evidence
DNA gives the most precise measure of relatedness.
DNA and Protein Comparisons
- Compare nucleotide sequences.
- Compare amino acid sequences in proteins.
- More similarity means more recent divergence.
Even small differences accumulate over time through mutation.
You might be given percent similarity between species and asked which are most closely related. Highest similarity = closest branch.
Molecular Clocks
Mutations accumulate at roughly steady rates in some genes.
- Scientists estimate divergence time by counting differences.
- Results often match fossil-based estimates.
Universal Genetic Code
All organisms use the same codon system for amino acids.
That shared code strongly supports a single common ancestor.
Extant and Extinct Organisms
- Extant species → DNA directly compared.
- Extinct species → ancient DNA from fossils.
Ancient DNA has confirmed relationships predicted from morphology alone.
5. Biogeography and Phylogenetic Trees
Biogeography
Biogeography studies species distribution.
Patterns that support evolution:
- Closely related species live near each other.
- Island species resemble nearby mainland species.
- Geographic barriers lead to genetic divergence.
Isolation → different selective pressures → speciation.
Phylogenetic Trees
Phylogenetic trees diagram evolutionary relationships over time. In the example below, a single ancestral lineage splits into two descendant lineages at a branching point.
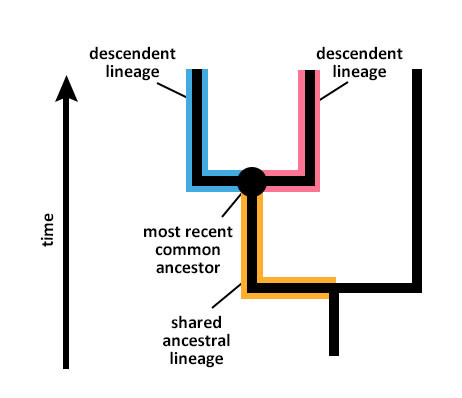
Basic phylogenetic tree with a most recent common ancestor
Key ideas:
- Nodes represent common ancestors, such as the most recent common ancestor shown at the branching point.
- Species that share a recent node are more closely related.
- Trees are hypotheses built from morphological and molecular data.
Students often misread trees by looking at left-to-right order. What matters is branching points and shared ancestry, not the position of the tips.
Key Takeaways
Evidence For Evolution
Scientific support from fossils, anatomy, molecules, geography, and quantitative analysis showing organisms changed over time.
Biogeography
The geographic distribution of species and populations across regions, islands, and barriers.
Fossil Record
The ordered collection of fossils in rock layers documenting past life and evolutionary change.
Stratigraphy
Relative dating using rock layer positions to infer whether fossils are older or younger.
Radiometric Dating
Absolute dating that uses radioactive isotope decay rates to estimate the age of rocks or fossils.
Carbon-14 Dating
Radiometric dating of recent organic remains using carbon-14 decay, effective to about 50,000 years.
Vestigial Structures
Reduced or nonfunctional remnants of features that were functional in ancestors.
DNA Sequence Comparison
Analysis of nucleotide similarity among organisms to infer relatedness and common ancestry.
Protein Sequence Comparison
Analysis of amino acid similarity in proteins to infer evolutionary relationships among organisms.
Universal Genetic Code
Nearly all organisms use the same codon-to-amino-acid system for protein synthesis.
Molecular Clock
A method estimating divergence time from the accumulation of DNA or protein sequence differences.
Phylogenetic Trees
Branching diagrams that represent hypothesized evolutionary relationships based on shared ancestry.
Homologous Vs. Analogous Structures
Similar anatomy from common ancestry is homologous, while similar function without shared origin is analogous.
Common Ancestry
The idea that different species descended from shared ancestral populations in the past.
Notes
Evidence For Evolution
Scientific support from fossils, anatomy, molecules, geography, and quantitative analysis showing organisms changed over time.
Biogeography
The geographic distribution of species and populations across regions, islands, and barriers.
Fossil Record
The ordered collection of fossils in rock layers documenting past life and evolutionary change.
Stratigraphy
Relative dating using rock layer positions to infer whether fossils are older or younger.
Radiometric Dating
Absolute dating that uses radioactive isotope decay rates to estimate the age of rocks or fossils.
Carbon-14 Dating
Radiometric dating of recent organic remains using carbon-14 decay, effective to about 50,000 years.
Vestigial Structures
Reduced or nonfunctional remnants of features that were functional in ancestors.
DNA Sequence Comparison
Analysis of nucleotide similarity among organisms to infer relatedness and common ancestry.
Protein Sequence Comparison
Analysis of amino acid similarity in proteins to infer evolutionary relationships among organisms.
Universal Genetic Code
Nearly all organisms use the same codon-to-amino-acid system for protein synthesis.
Molecular Clock
A method estimating divergence time from the accumulation of DNA or protein sequence differences.
Phylogenetic Trees
Branching diagrams that represent hypothesized evolutionary relationships based on shared ancestry.
Homologous Vs. Analogous Structures
Similar anatomy from common ancestry is homologous, while similar function without shared origin is analogous.
Common Ancestry
The idea that different species descended from shared ancestral populations in the past.
