Topic 8.3 Notes – Population Ecology
1. What a Population Is and What Changes Its Size
A population is a group of individuals of the same species living in the same area at the same time. That “same species” part matters because members can potentially reproduce with one another and share a gene pool.
Inside a population, individuals interact in two major ways:
- With each other
- Compete for food, space, mates
- Cooperate (herds, packs, colonies)
- Spread disease more easily when crowded
- With the environment
- Use resources like food, water, oxygen
- Respond to climate, temperature, storms
- Depend on habitat structure (nesting sites, soil, reef structure)
All of that feeds into one big question: why does population size change?
Birth Rate (B)
Birth rate is the number of individuals added through reproduction per unit time.
It increases population size and depends on:
- Access to energy and matter (food = energy source for reproduction)
- Availability of mates
- Environmental conditions (temperature, rainfall)
- Species traits (some species produce hundreds of offspring, others very few)
Many adaptations you’ve learned about tie directly into birth rate. For example:
- Plants in dry climates that store water → survive longer → reproduce more
- Animals with parental care → higher offspring survival
Death Rate (D)
Death rate is the number of individuals that die per unit time.
It decreases population size and is influenced by:
- Predation
- Disease
- Competition for limited resources
- Extreme abiotic conditions (drought, freeze, wildfire)
Population Size (N)
N is the total number of individuals in the population.
Population size itself affects:
- Intraspecific competition (more individuals → more competition)
- Disease spread (higher density → faster transmission)
- Total number of births (more individuals = more potential parents)
So birth rate, death rate, and population size are tightly connected.
2. The Basic Population Growth Equation
All of that gets summarized in one simple model:
Where:
- = change in population size
- = change in time
- = birth rate
- = death rate
This equation just says: population change equals births minus deaths.
Interpretation:
- If , then → population increases
- If , then → population decreases
- If , population stays stable
On tests, you might be given birth and death data in a table and asked to determine whether the population is growing or shrinking. Don’t overthink it. Compare B and D.
3. Exponential Growth
When resources are unlimited and there are no major constraints, populations can grow exponentially.
That growth is modeled by:
Where:
- = maximum per capita growth rate
- = population size
This equation says the growth rate depends on how many individuals are already there.
Why growth accelerates
If each individual produces offspring at a constant rate:
- More individuals → more total births
- More births → even more individuals
- Growth compounds over time
That produces a J-shaped curve.
Here’s what that looks like. Focus on the blue curve labeled “Exponential Growth.”
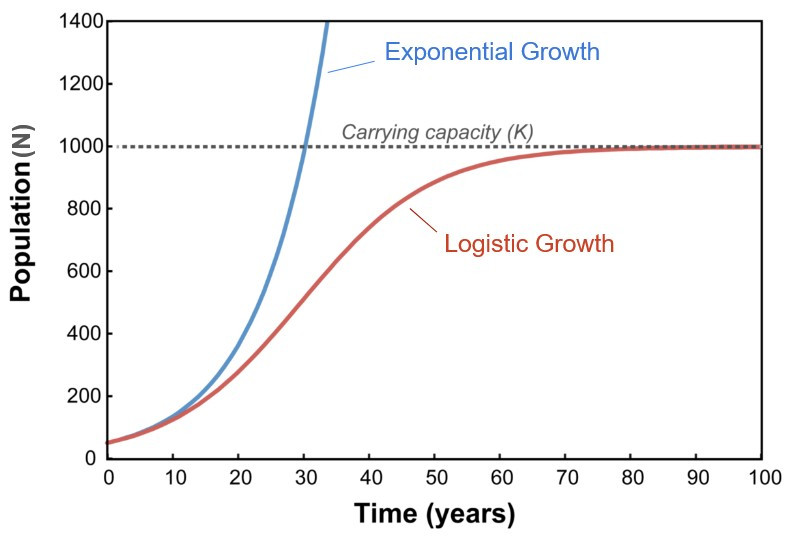
Exponential vs. logistic population growth
What represents
It reflects the species’ maximum reproductive capacity under ideal conditions:
- Unlimited resources
- Minimal competition
- Low mortality
- Ideal environmental conditions
In real ecosystems, those conditions rarely last. But short-term exponential growth can happen, especially when a species enters a new environment.
On the AP exam, they often give you a graph and expect you to recognize exponential growth from the J-shape and connect it to reproduction without constraints.
4. Environmental Factors That Influence Population Growth
Now connect the math back to biology. What changes B and D?
Resource Availability
- More food, water, nutrients → higher B, lower D
- Scarcity → starvation, reduced reproduction
Habitat
- Loss of nesting sites or territory → lower survival and reproduction
Competition
- Intraspecific (same species)
- Interspecific (different species)
Competition reduces access to resources, often lowering birth rate.
Predation
- Directly increases death rate
- Can regulate prey populations
Disease
- Spreads faster in dense populations
- Raises death rate
Climate and Abiotic Conditions
- Temperature and rainfall affect resource availability
- Natural disasters can rapidly increase death rate
Every one of these factors works by altering birth rate, death rate, or both.
5. Adaptations and Population Growth
Many organismal traits exist because they improve access to energy and matter in specific environments.
Examples:
- Deep roots in desert plants → better water access
- Thick fur in cold climates → lower mortality
- High reproductive output in unstable environments → higher
These adaptations affect:
- Birth rate
- Death rate
- Maximum growth rate
So population ecology ties together:
- Individual traits
- Environmental conditions
- Resource availability
- Mathematical growth models
That connection between traits and population-level outcomes is something the AP loves to test in data-based questions.
Key Takeaways
Population
A group of individuals of the same species living in the same area.
Population Growth Equation
Change in population size over time equals births minus deaths: dN/dt = B - D.
Exponential Growth
Rapid increase at a constant per capita rate under ideal, unlimited conditions, producing a J-shaped curve.
Exponential Growth Equation
Population change equals maximum per capita growth rate times population size: dN/dt = rmaxN.
Maximum Per Capita Growth Rate (rmax)
The highest possible per individual growth rate under ideal environmental conditions.
Limiting Factors
Environmental conditions that restrict population growth by reducing survival or reproduction.
Biotic and Abiotic Factors
Biotic factors are living influences; abiotic factors are nonliving physical and chemical influences.
Resource Availability
The supply of food, water, oxygen, shelter, and other necessities in an environment.
Habitat
The environment where organisms live, obtain resources, and reproduce.
Competition
The struggle among organisms for limited resources needed for survival and reproduction.
Predation
An interaction in which one organism kills and eats another.
Disease
The spread of pathogens within a population that lowers survival or reproduction.
Climate
Long-term patterns of temperature, precipitation, and weather that affect habitats and resources.
Adaptations for Obtaining Energy and Matter
Inherited traits that help organisms acquire and use resources in a specific environment.
J-Shaped Growth Curve
A graph pattern showing rapid exponential increase when resources are unlimited.
Notes
Population
A group of individuals of the same species living in the same area.
Population Growth Equation
Change in population size over time equals births minus deaths: dN/dt = B - D.
Exponential Growth
Rapid increase at a constant per capita rate under ideal, unlimited conditions, producing a J-shaped curve.
Exponential Growth Equation
Population change equals maximum per capita growth rate times population size: dN/dt = rmaxN.
Maximum Per Capita Growth Rate (rmax)
The highest possible per individual growth rate under ideal environmental conditions.
Limiting Factors
Environmental conditions that restrict population growth by reducing survival or reproduction.
Biotic and Abiotic Factors
Biotic factors are living influences; abiotic factors are nonliving physical and chemical influences.
Resource Availability
The supply of food, water, oxygen, shelter, and other necessities in an environment.
Habitat
The environment where organisms live, obtain resources, and reproduce.
Competition
The struggle among organisms for limited resources needed for survival and reproduction.
Predation
An interaction in which one organism kills and eats another.
Disease
The spread of pathogens within a population that lowers survival or reproduction.
Climate
Long-term patterns of temperature, precipitation, and weather that affect habitats and resources.
Adaptations for Obtaining Energy and Matter
Inherited traits that help organisms acquire and use resources in a specific environment.
J-Shaped Growth Curve
A graph pattern showing rapid exponential increase when resources are unlimited.
