Topic 7.9 Notes – Phylogeny
1. What Phylogeny Is
A phylogeny is the evolutionary history of a group of organisms.
Evolution does not move in a straight line. It branches. When one population splits into two and they become reproductively isolated, a speciation event has occurred. On a diagram, that split becomes a branch point.
Two core ideas hold everything together:
- Common ancestor
A past population from which multiple lineages descended. - More recent common ancestor = more closely related
If two species share a recent branch point, they are more closely related than species that connect farther back.
Phylogenetic diagrams are hypotheses. They are built from evidence and can change if new DNA data or fossils are discovered. On the AP exam, that word hypothesis matters. These trees represent the best-supported explanation, not absolute proof.
2. Types of Evolutionary Diagrams
Both diagrams show relationships, but they communicate different levels of detail.
Cladograms
A cladogram shows branching order only.
- Built using shared derived characters
- Branch lengths are equal and not scaled
- Focuses on who is more closely related
- Does not show time or amount of evolutionary change
Phylogenetic Trees
A phylogenetic tree includes branching pattern plus information about evolutionary change.
- Branch lengths may represent:
- Time since divergence
- Amount of genetic change
- Often calibrated using:
- Fossils
- Molecular clocks
Here’s a clean comparison:
| Feature | Cladogram | Phylogenetic Tree |
|---|---|---|
| Branch Length | Equal; not meaningful | Represents time or amount of change |
| Time Scale | Not shown | Often calibrated with fossils or molecular data |
| Main Focus | Pattern of relatedness | Relatedness + evolutionary change |
On the AP exam, “cladogram” and “phylogenetic tree” are often used interchangeably. Treat branch lengths as meaningful only when the diagram is drawn to scale.
If a question shows unequal branch lengths and asks about “more genetic change,” you are looking at a phylogenetic tree.
3. Evidence Used to Construct Phylogenies
Scientists compare traits that are gained or lost over time.
Morphological Evidence
This uses physical characteristics.
Important terms:
- Shared characters
Traits found in multiple groups (example: vertebrae in vertebrates). - Shared derived characters (synapomorphies)
Traits that evolved in a recent common ancestor and are present in all its descendants.
These are the most informative traits for building trees. - Homologous structures
Same underlying structure, different function. Indicates common ancestry.
Limits of morphology:
- Convergent evolution can produce similar traits in unrelated groups.
- Environmental factors can influence appearance.
- Trait classification can be subjective.
Molecular Evidence
This compares:
- DNA sequences
- RNA sequences
- Amino acid sequences
- Whole genomes
Molecular data are typically more reliable because:
- They provide large amounts of measurable data.
- They are less influenced by environmental conditions.
- They reveal relationships between organisms that look very different.
On the AP exam, if asked which evidence is stronger for determining relatedness, molecular data usually wins unless the question gives a reason otherwise.
4. Key Structural Features of Phylogenetic Trees
Here is a labeled example of a typical tree. Notice the branch points, shared versus unique evolutionary history, and the highlighted example of a clade compared with groups that are not clades.
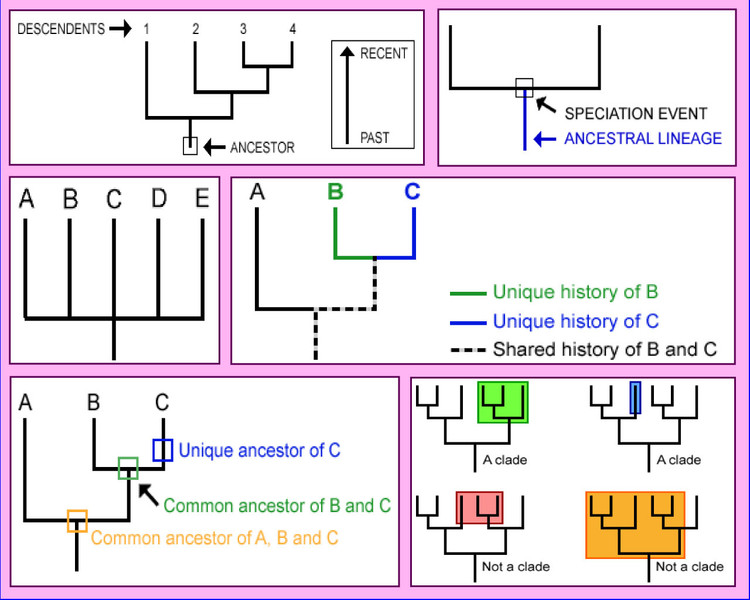
Structural features of phylogenetic trees
Key parts:
- Node
A branch point. Represents the most recent common ancestor and a speciation event. - Branches
Lineages evolving over time. - Terminal nodes (tips)
Represent living or fossil taxa.
No living species is the ancestor of another living species. - Clade (monophyletic group)
An ancestor and all of its descendants.
Know these contrasts:
- Monophyletic → ancestor + all descendants
- Paraphyletic → ancestor + some descendants
- Polyphyletic → organisms from different lineages
- Outgroup
The least closely related lineage.
Used to root the tree and determine which traits are ancestral versus derived.
5. How to Interpret and Use Phylogenies
To compare two species:
- Trace backward from each tip.
- Find where their branches meet.
- The closer that node is to the present, the more closely related they are.
Things students often miss:
- Trees can rotate around nodes without changing relationships.
- The left-to-right order does not matter.
- Species at the “top” are not more evolved.
What these diagrams show:
- The pattern of speciation
- The sequence of divergence events
- Relative timing if branch lengths are scaled
- Evidence of shared ancestry and unity of life
Because phylogenies are hypotheses, new fossils or new DNA sequencing methods can change them. That revision process is part of science.
Key Takeaways
Cladogram
A branching diagram showing relative relatedness based on shared derived characters, not time scale.
Node
A branch point representing the most recent common ancestor and a speciation event.
Terminal Node / Tip
The end of a branch representing an observed species or taxonomic group.
Outgroup
The lineage least closely related to the others, used to root the tree.
Shared Character vs. Shared Derived Character
Shared characters occur in multiple groups; shared derived characters evolved later and indicate common ancestry.
Homologous Structures
Body parts with similar underlying anatomy due to common ancestry, despite possible different functions.
Morphological Evidence
Comparisons of physical traits in living or fossil organisms used to infer evolutionary relationships.
Molecular Data vs. Morphological Data
Molecular data are usually more accurate; morphology can be misleading from convergent evolution.
Convergent Evolution
Independent evolution of similar traits in unrelated lineages due to similar selective pressures.
Molecular Clock
A method estimating divergence time from the rate of accumulated molecular changes.
Fossil Calibration
Using dated fossils to estimate when lineages diverged on a phylogenetic tree.
Branch Length Meaning
On phylogenetic trees, longer branches indicate more evolutionary change; cladograms are not scaled.
Clade / Monophyletic Group
An ancestor and all of its descendants considered as one evolutionary group.
Paraphyletic vs. Polyphyletic Group
Paraphyletic groups exclude some descendants; polyphyletic groups combine members from different ancestors.
Rooting a Tree
Establishing the ancestral base of a phylogeny, usually by comparing the ingroup with an outgroup.
Tree Rotation Principle
Branches can rotate around a node without changing the evolutionary relationships shown.
How to Infer Relatedness from a Tree
Lineages sharing a more recent common ancestor are more closely related than those diverging earlier.
Phylogenetic Tree vs. Cladogram
Branching diagrams show relationships, but only phylogenetic trees indicate evolutionary change and often time.
Molecular Evidence
DNA or protein sequence comparisons infer relatedness, with greater similarity indicating closer ancestry.
Phylogenies as Hypotheses
Testable models of evolutionary relationships that are revised when new evidence appears.
Notes
Cladogram
A branching diagram showing relative relatedness based on shared derived characters, not time scale.
Node
A branch point representing the most recent common ancestor and a speciation event.
Terminal Node / Tip
The end of a branch representing an observed species or taxonomic group.
Outgroup
The lineage least closely related to the others, used to root the tree.
Shared Character vs. Shared Derived Character
Shared characters occur in multiple groups; shared derived characters evolved later and indicate common ancestry.
Homologous Structures
Body parts with similar underlying anatomy due to common ancestry, despite possible different functions.
Morphological Evidence
Comparisons of physical traits in living or fossil organisms used to infer evolutionary relationships.
Molecular Data vs. Morphological Data
Molecular data are usually more accurate; morphology can be misleading from convergent evolution.
Convergent Evolution
Independent evolution of similar traits in unrelated lineages due to similar selective pressures.
Molecular Clock
A method estimating divergence time from the rate of accumulated molecular changes.
Fossil Calibration
Using dated fossils to estimate when lineages diverged on a phylogenetic tree.
Branch Length Meaning
On phylogenetic trees, longer branches indicate more evolutionary change; cladograms are not scaled.
Clade / Monophyletic Group
An ancestor and all of its descendants considered as one evolutionary group.
Paraphyletic vs. Polyphyletic Group
Paraphyletic groups exclude some descendants; polyphyletic groups combine members from different ancestors.
Rooting a Tree
Establishing the ancestral base of a phylogeny, usually by comparing the ingroup with an outgroup.
Tree Rotation Principle
Branches can rotate around a node without changing the evolutionary relationships shown.
How to Infer Relatedness from a Tree
Lineages sharing a more recent common ancestor are more closely related than those diverging earlier.
Phylogenetic Tree vs. Cladogram
Branching diagrams show relationships, but only phylogenetic trees indicate evolutionary change and often time.
Molecular Evidence
DNA or protein sequence comparisons infer relatedness, with greater similarity indicating closer ancestry.
Phylogenies as Hypotheses
Testable models of evolutionary relationships that are revised when new evidence appears.
