Topic 1.10 Notes – The Normal Distribution
1. What a Normal Distribution Is
A normal distribution is a continuous, symmetric, mound-shaped distribution described by a smooth density curve. The total area under the curve is 1, which represents 100% of possible observations.
Here’s the general shape of a normal curve:
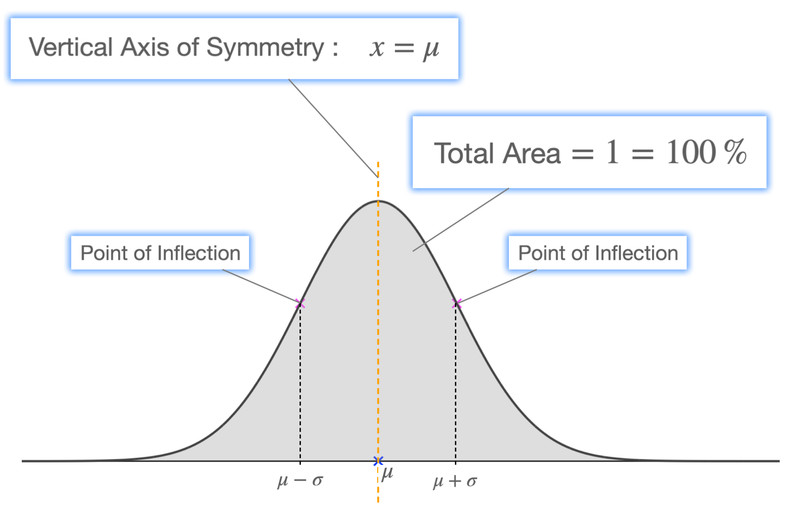
Normal distribution (bell curve) with mean μ and standard deviation σ
Key features:
- Symmetric about μ (the mean is the center and the vertical line of symmetry).
- Unimodal (one peak).
- Tails extend infinitely (they approach but never touch the axis).
- Inflection points at μ ± σ (where the curve changes concavity).
A normal distribution is completely determined by two population parameters:
- μ (mu) = population mean (center).
- σ (sigma) = population standard deviation (spread).
We write it as N(μ, σ). These are model parameters that describe a population, not sample statistics like or .
Some real-world variables are often approximately normal, like adult heights, body temperature, or the weight of loaves of bread from a well-controlled bakery. But not all data are normal.
Before using a normal model, check:
- Histogram looks roughly symmetric and unimodal.
- Normal probability plot is roughly linear.
If the data are clearly skewed or have multiple peaks, don’t force a normal model.
2. The Empirical Rule and What It Tells You
For any normal distribution, the 68-95-99.7 rule applies:
- About 68% of observations are within 1σ of μ.
- About 95% are within 2σ.
- About 99.7% are within 3σ.
The shaded regions in the normal curve below show these percentages centered at μ.
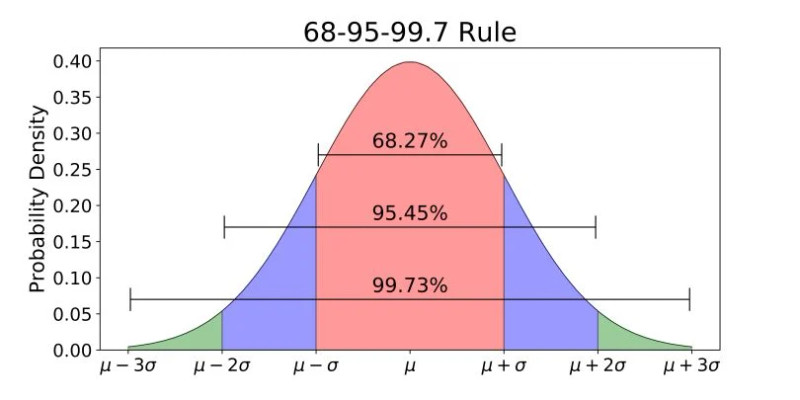
Empirical Rule for a normal distribution
This lets you make quick estimates without a calculator. For example, if loaf weights are N(500 grams, 5 grams), about 95% of loaves weigh between 490 and 510 grams.
Values beyond:
- 2σ are somewhat unusual.
- 3σ are very unusual.
Only use this rule if the distribution is normal. It does not apply to skewed data.
3. Z-Scores and Standardizing Values
A z-score tells how many standard deviations a value is from the mean.
- → above the mean
- → below the mean
- Larger → more unusual
When you standardize, you convert a normal distribution into the standard normal distribution, N(0, 1).
- Mean becomes 0.
- Standard deviation becomes 1.
- Units disappear.
Example: If body temperature is N(98.6°F, 0.6°F), and someone’s temperature is 99.4°F:
That temperature is about 1.33 standard deviations above average.
Transformations:
- Adding/subtracting a constant changes the mean, not shape or spread.
- Multiplying/dividing by a constant changes mean and standard deviation, not shape.
MC questions love asking what happens to mean and standard deviation after transformations.
4. Finding Proportions and Percentiles in a Normal Distribution
Once you standardize, you use technology.
A. Finding a Proportion Given a Value
Suppose bread weights are N(500, 5). What proportion weigh less than 508 grams?
- Convert to z:
- Use calculator:
normalcdf(-1E99, 508, 500, 5)
or use standard normal with z = 1.6. - Interpret in context.
You would say:
“About 0.945 of loaves weigh less than 508 grams.”
Always answer in context, not just with a decimal.
Left of a value = cumulative area.
Right of a value = 1 minus left area.
Between two values = subtract cumulative areas.
B. Finding a Value Given a Percentile
Suppose the bakery wants the top 10% heaviest loaves.
- Area to the left is 0.90.
- Use
invNorm(0.90, 500, 5). - Interpret.
You might get about 506.4 grams.
So the cutoff for the heaviest 10% is about 506.4 grams.
This shows up when you’re asked for minimum qualifying scores or percentiles.
5. Comparing Relative Position with Z-Scores and Percentiles
Two ways to describe relative standing:
- Z-score → number of standard deviations from the mean.
- Percentile → percent of observations at or below a value.
If you’re comparing scores from different tests with different spreads, raw scores are meaningless. Compare z-scores instead.
Higher z-score = better relative performance.
Percentiles are easier to explain in context.
Z-scores are better for mathematical comparison.
On FRQs, if you’re asked who performed better relative to their group, compute and compare z-scores.
Key Takeaways
Parameter
A numerical summary that describes a population, such as μ or σ.
Empirical Rule
About 68%, 95%, and 99.7% of values lie within 1, 2, and 3 standard deviations.
Finding Proportions in a Normal Distribution
Use z-scores with a calculator, z-table, or software to find area under the curve.
Finding a Value from a Given Normal Area
Use inverse normal technology with a mean, standard deviation, and area to estimate a data value.
Shifting and Rescaling Data
Adding or subtracting shifts center; multiplying or dividing rescales spread without changing shape.
Variables Commonly Modeled by a Normal Distribution
Many real variables, like body temperature or loaf weight, can be approximated by a normal model.
Approximately Normal Distribution
A distribution that is roughly symmetric, unimodal, and mound-shaped, like a normal curve.
Normal Distribution Parameters
Its center is set by μ, spread by σ, and the standard model is N(0,1).
Z-Score
A standardized value found by subtracting the mean and dividing by the standard deviation.
Percentiles and Z-Scores
Measures of relative position used to compare observations within or between distributions.
Notes
Parameter
A numerical summary that describes a population, such as μ or σ.
Empirical Rule
About 68%, 95%, and 99.7% of values lie within 1, 2, and 3 standard deviations.
Finding Proportions in a Normal Distribution
Use z-scores with a calculator, z-table, or software to find area under the curve.
Finding a Value from a Given Normal Area
Use inverse normal technology with a mean, standard deviation, and area to estimate a data value.
Shifting and Rescaling Data
Adding or subtracting shifts center; multiplying or dividing rescales spread without changing shape.
Variables Commonly Modeled by a Normal Distribution
Many real variables, like body temperature or loaf weight, can be approximated by a normal model.
Approximately Normal Distribution
A distribution that is roughly symmetric, unimodal, and mound-shaped, like a normal curve.
Normal Distribution Parameters
Its center is set by μ, spread by σ, and the standard model is N(0,1).
Z-Score
A standardized value found by subtracting the mean and dividing by the standard deviation.
Percentiles and Z-Scores
Measures of relative position used to compare observations within or between distributions.
