Topic 1.3 Notes – Representing a Categorical Variable with Tables
1. Frequency Tables and Relative Frequency Tables
When your variable is categorical (labels, not numbers you can average), the first step is organizing counts.
Frequency Table
A frequency table lists:
- Each category
- The number of observations in that category (the frequency)
If 50 students were asked their favorite school lunch and 18 said pizza, the frequency for pizza is 18.
Key facts:
- The frequencies must add up to the total sample size .
- A frequency table answers: “How many?”
Here’s what that structure looks like for a survey of 50 students about their favorite pet:
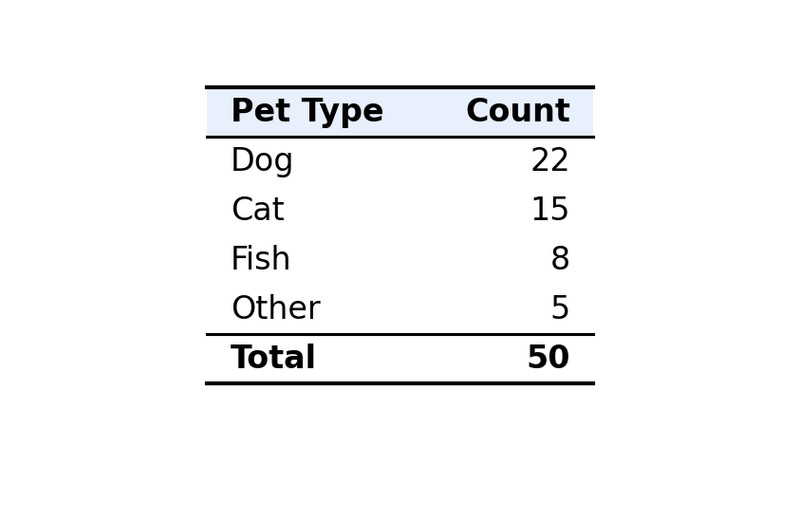
Example frequency table for favorite pet (n = 50)
You should always mentally check that the counts sum to 50.
Relative Frequency Table
A relative frequency table shows the proportion (or percent) in each category instead of raw counts.
The formula is:
Using the same pet example:
- Dogs:
- Cats:
Those decimals are proportions. Multiply by 100 to get percentages.
Important:
- Proportions add to 1 (or very close).
- Percentages add to 100% (rounding can make it 99% or 101%).
Proportion, relative frequency, percentage, and rate all communicate the same idea. They’re just different formats.
A relative frequency table answers: “What fraction or percent?”
2. Constructing the Tables Correctly
When you’re given raw data, build the table carefully.
- Identify the categorical variable.
- List all possible categories.
- Count observations in each category.
- Confirm totals add to .
- Divide each count by for relative frequencies.
- Convert to percentages if needed.
- Check that proportions ≈ 1.
Two structural rules matter a lot:
- Mutually exclusive categories → each observation fits in only one category.
- Collectively exhaustive categories → every observation fits somewhere.
If categories overlap, your counts won’t make sense.
Label columns clearly. On tests, unlabeled columns cost clarity points fast.
3. What Tables Reveal About Categorical Data
Once the table is built, you’re looking for patterns.
Tables show:
- The most common category (largest count or percent)
- The least common category
- Whether responses are evenly spread or concentrated
- Whether categories might be meaningfully combined (if context allows)
For example, if 44% prefer dogs and 30% prefer cats, you can say:
“In this sample of 50 students, a larger proportion preferred dogs (44%) than cats (30%).”
Notice the structure:
- Identify the group
- State the percentage
- Compare clearly
Avoid vague phrases like “a lot” or “most” without numbers. On FRQs, unsupported claims lose points.
Counts and relative frequencies both justify claims. You just need to use them correctly.
4. Describing Categorical Data in Context
When you describe a distribution from a table, always:
- Name the variable
- Mention the population or sample
- Use numbers
- Compare categories when relevant
Strong example:
“Among the 120 surveyed voters, 52% preferred Candidate A, compared to 35% who preferred Candidate B.”
That’s statistical language in context.
Counts vs Relative Frequencies
Use counts when:
- Comparing groups of the same size
- The question focuses on actual individuals
Use percentages/proportions when:
- Comparing groups of different sizes
- Communicating results broadly
- Making general claims
If one class has 30 students and another has 120, comparing raw counts is misleading. Percentages level the playing field.
5. Common Exam Mistakes
- Relative frequencies don’t sum to 1 (check your division).
- Reporting “0.38” without saying what it represents.
- Forgetting context in conclusions.
- Trying to compute a mean of categories.
- Dividing by the wrong total when computing proportions.
Most mistakes here aren’t complicated. They’re carelessness or missing context.
Key Takeaways
Frequency Table
A table listing each category and the number of observations in that category.
Relative Frequency, Percentage, And Rate
A category’s share of the total, written as a proportion, percent, or rate.
Describing Categorical Data In Context
Use counts or proportions to compare categories and justify claims in context.
Notes
Frequency Table
A table listing each category and the number of observations in that category.
Relative Frequency, Percentage, And Rate
A category’s share of the total, written as a proportion, percent, or rate.
Describing Categorical Data In Context
Use counts or proportions to compare categories and justify claims in context.
