Topic 6.2 Notes – Constructing a Confidence Interval for a Population Proportion
1. The One-Sample z-Interval for a Population Proportion
You use this procedure when:
- You have one sample
- The variable is categorical (yes/no, success/failure)
- You want to estimate a single population proportion
The sample gives you a sample proportion:
where is the number of “successes” and is the sample size.
Every confidence interval has this structure:
For a proportion:
- Point estimate →
- Standard error →
- Margin of error →
So the full interval is:
comes from the standard normal distribution and depends on confidence level:
- 90% → 1.645
- 95% → 1.96
- 99% → 2.576
On the AP exam, this formula is not printed for you, but you can build it from “statistic ± (critical value)(standard error)” and the standard error formula.
2. Conditions for Inference
No conditions, no inference credit. Even if your math is perfect.
Random
Data must come from a random sample or randomized experiment.
If the sample wasn’t random, you cannot generalize to the population.
Independence
When sampling without replacement, check:
In words: the population is at least 10 times the sample size.
State it in context, not just as a formula.
Large Counts Condition
We need the sampling distribution of to be approximately normal.
Check:
That means at least 10 expected successes and 10 expected failures.
Important detail: for confidence intervals, use in this check. (Using a hypothesized is for hypothesis tests, which is next topic.)
3. How to Construct the Interval
Here’s how it flows on a quiz or FRQ.
- State the parameter and procedure
“We want to estimate , the true proportion of ___ in the population. A one-sample z-interval for a proportion is appropriate.” - Check conditions
Random, 10%, Large Counts - all in context. - Calculate
- Find
- Find
- Compute standard error
- Compute margin of error
- Write the interval
- Interpret in context
Correct model:
We are 95% confident that the true proportion of [population + variable] is between ___ and ___.
You must mention:
- Confidence level
- Population
- Variable
- The word “proportion”
Do not say there is a 95% chance the true proportion is in this interval.
To picture where comes from, think about the middle area of the normal curve. The critical value cuts off the middle chunk that matches your confidence level.
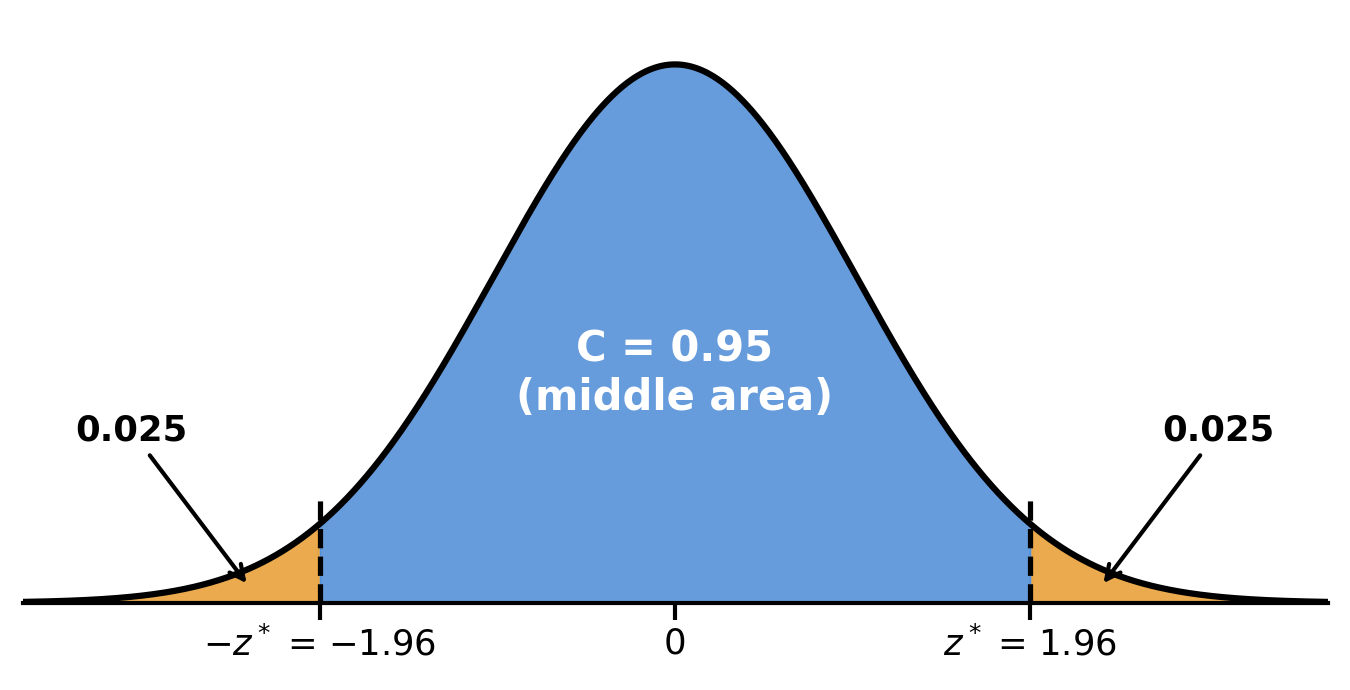
For 95% confidence, the middle area lies between and , leaving 0.025 in each tail.
The shaded middle area represents the confidence level. For a 95% confidence interval, you want the central 0.95 of the distribution, which gives .
Calculator shortcut (TI-84):
STAT → TESTS → 1-PropZInt → enter , , confidence level.
4. Margin of Error and Sample Size
The margin of error is:
Three big ideas:
- Higher confidence → larger → wider interval
- Larger → smaller standard error → narrower interval
- Variability is largest when
Finding Required Sample Size
Rearranging gives:
To plan ahead:
- Use a previous estimate for , or
- Use for the most conservative (largest) sample size.
Always round up. If you round down, your margin of error might be too large.
5. What Confidence Level Means
The correct meaning:
If we repeated this sampling method many times, about C% of the resulting intervals would capture the true population proportion.
The parameter is fixed. The interval changes from sample to sample.
That subtle wording difference shows up constantly in AP grading.
Key Takeaways
Confidence Interval for a Population Proportion
An interval of plausible values for a population proportion based on sample data.
One-Sample Z-Interval for a Proportion
The inference procedure used to estimate one population proportion from one categorical sample.
Conditions for a One-Sample Proportion Interval
Check randomization, independence with the 10% condition, and large counts for approximate normality.
Random Sample / Randomized Experiment
Data must come from random selection or random assignment to justify inference assumptions.
10% Condition
When sampling without replacement, the sample size must be no more than 10% of the population.
Large Counts Condition
The counts np-hat and n(1 minus p-hat) must both be at least 10.
Sample Proportion (p-Hat)
The proportion of successes in the sample, used as the point estimate of p.
Point Estimate
A single sample statistic used to estimate the corresponding population parameter.
Standard Error of p-Hat
The estimated standard deviation of p-hat, equal to sqrt[p-hat(1 minus p-hat)/n].
Critical Value (z-Star)
The z-score cutting off the middle C% of the standard normal distribution.
Confidence Level
The long-run percent of similarly constructed intervals that capture the true parameter.
One-Sample Proportion Confidence Interval Formula
Construct p-hat plus or minus z-star times sqrt[p-hat(1 minus p-hat)/n].
Sample Size and Margin of Error
Larger samples produce smaller standard errors and narrower confidence intervals.
Minimum Sample Size for a Desired Margin of Error
Solve the margin of error formula for n using a guessed p-hat or 0.5.
Using p-Hat = 0.5 for Sample Size
Use 0.5 when no estimate is available to get the largest required sample size.
Interval Estimate in Context
State the confidence interval as a range of plausible population proportions with proper units or labels.
Margin of Error for a Proportion
The amount added and subtracted from p-hat, equal to z-star times its standard error.
Success-Failure Condition
The sample must have at least 10 successes and 10 failures for normality.
Notes
Confidence Interval for a Population Proportion
An interval of plausible values for a population proportion based on sample data.
One-Sample Z-Interval for a Proportion
The inference procedure used to estimate one population proportion from one categorical sample.
Conditions for a One-Sample Proportion Interval
Check randomization, independence with the 10% condition, and large counts for approximate normality.
Random Sample / Randomized Experiment
Data must come from random selection or random assignment to justify inference assumptions.
10% Condition
When sampling without replacement, the sample size must be no more than 10% of the population.
Large Counts Condition
The counts np-hat and n(1 minus p-hat) must both be at least 10.
Sample Proportion (p-Hat)
The proportion of successes in the sample, used as the point estimate of p.
Point Estimate
A single sample statistic used to estimate the corresponding population parameter.
Standard Error of p-Hat
The estimated standard deviation of p-hat, equal to sqrt[p-hat(1 minus p-hat)/n].
Critical Value (z-Star)
The z-score cutting off the middle C% of the standard normal distribution.
Confidence Level
The long-run percent of similarly constructed intervals that capture the true parameter.
One-Sample Proportion Confidence Interval Formula
Construct p-hat plus or minus z-star times sqrt[p-hat(1 minus p-hat)/n].
Sample Size and Margin of Error
Larger samples produce smaller standard errors and narrower confidence intervals.
Minimum Sample Size for a Desired Margin of Error
Solve the margin of error formula for n using a guessed p-hat or 0.5.
Using p-Hat = 0.5 for Sample Size
Use 0.5 when no estimate is available to get the largest required sample size.
Interval Estimate in Context
State the confidence interval as a range of plausible population proportions with proper units or labels.
Margin of Error for a Proportion
The amount added and subtracted from p-hat, equal to z-star times its standard error.
Success-Failure Condition
The sample must have at least 10 successes and 10 failures for normality.
