Topic 9.6 Notes – Skills Focus: Selecting an Appropriate Inference Procedure
The Big Picture Decision
Every inference question starts with one of two goals:
- Estimate a parameter → Confidence interval
- Test a claim about a parameter → Hypothesis test
That’s step one. Then you narrow it down.
There are three things you must identify:
- Type of variable
- Categorical → proportions or counts
- Quantitative → means or slope
- Number of samples
- One sample
- Two independent samples
- Matched pairs
- Parameter of interest
- (true slope)
If you can state those three clearly, you’re done thinking. The name of the procedure follows automatically.
One-Sample Procedures
These happen when you have one group and one variable.
One Proportion z Test / Interval
Use when:
- Variable is categorical
- One sample
- Parameter is
Example situation: “What proportion of students at this school prefer online homework?”
Conditions include:
- Random
- 10% condition
- Large counts and
If you see the word proportion and just one group, this is your move.
One Sample t Test / Interval
Use when:
- Variable is quantitative
- One sample
- Parameter is
Example: “Is the mean commute time for teachers at this school different from 25 minutes?”
For means, you almost always use t, not z.
Check:
- Random
- 10% condition
- Nearly Normal or large sample (no strong skew/outliers or )
Students often grab z by habit. If it’s a mean and you’re using sample standard deviation, it’s t.
Two-Sample Procedures
Now you have two groups. The key question becomes: independent or paired?
Two Proportion z Test / Interval
- Two independent groups
- Categorical variable
- Parameter:
Example: Compare support for a policy between urban and rural voters.
You must check large counts for both groups.
Two Sample t Test / Interval
- Two independent groups
- Quantitative variable
- Parameter:
Example: Compare mean recovery time for patients on Drug A vs Drug B.
Make sure the groups are independent. If the same people are measured twice, this is wrong.
Matched Pairs t Test
This one trips people up.
Use when:
- One quantitative variable
- Same subjects measured twice (before/after)
OR naturally paired subjects (twins, matched partners)
Parameter: mean difference
You:
- Compute differences
- Reduce to a one-sample t test on those differences
Here’s the idea. You turn each pair of measurements into a single difference, then run a one-sample t test on those values.

Matched pairs reduced to a one-sample t test on differences
If you see “before and after,” slow down and think paired.
Chi-Square Tests (Categorical Counts Only)
These are about distributions of counts, not proportions with z formulas.
Goodness of Fit
- One categorical variable
- Compare observed counts to a claimed distribution
Example: Do these dice outcomes match a fair die?
Test for Independence
- Two categorical variables
- One population
- Is there an association?
Example: Is snack preference related to grade level within one school?
Test for Homogeneity
- Compare distributions across multiple populations
Example: Do brand preferences differ across three cities?
All chi-square tests require:
- Random
- 10% condition
- All expected counts ≥ 5
If you’re comparing just two proportions, do not use chi-square. That’s a two-proportion z test.
Linear Regression t Procedures
Use when:
- Two quantitative variables
- You’re studying a linear relationship
Parameter: (true slope)
The usual test:
On the AP exam, you’ll usually be given computer output like this. Focus on the row for the explanatory variable and these columns:
- Slope estimate (coef)
- Standard error (std err)
- t statistic (t)
- p-value (P>|t|)
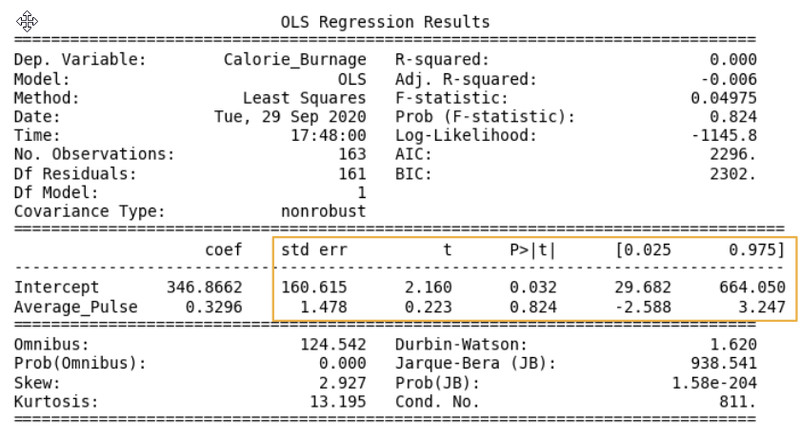
Typical regression output table
If the question asks about the “relationship between two quantitative variables,” think regression immediately.
Step-by-Step Decision Flow
- Interval or test?
- Categorical or quantitative variable?
- One sample, two independent samples, or matched pairs?
- If categorical:
- Comparing proportions → z
- Comparing distributions → chi-square
- If quantitative:
- One or two groups → t
- Two variables with a linear relationship → regression t
When grading FRQs, they want the procedure name clearly stated, like “two-sample t test for a difference in means.” Vague answers lose points.
Key Takeaways
Inference Procedure Selection
Choose the method by identifying parameter type, number of samples, design, and variable type.
Confidence Interval vs Hypothesis Test
Estimate a plausible parameter range with an interval, or evaluate a claim with a test.
One Proportion Z Procedures
Use for one population proportion; z-interval estimates it, z-test compares it to a claimed value.
One Sample T Procedures
Use for one population mean; t-interval estimates it, t-test compares it to a claimed value.
Two Proportion Z Procedures
Use for comparing two population proportions; z-interval estimates difference, z-test tests claimed difference.
Chi-Square Goodness of Fit Test
Tests whether one categorical variable's distribution matches a claimed distribution.
Chi-Square Test for Independence
Tests whether two categorical variables are associated in one population.
Chi-Square Test for Homogeneity
Tests whether categorical distributions are the same across multiple populations or treatments.
Linear Regression T Procedures
Use for slope inference in least-squares regression; interval estimates slope, test checks if slope equals zero.
How To Distinguish The Three Chi-Square Tests
Goodness of fit compares one distribution, independence checks association, homogeneity compares group distributions.
Categorical vs Quantitative Inference
Use z procedures for categorical proportions and t procedures for quantitative means.
Choosing Between Matched Pairs and Two-Sample T Procedures
Use paired differences for linked data and two-sample methods for independent groups.
Recognizing Regression Inference
Use slope inference for two quantitative variables, often using regression computer output.
Notes
Inference Procedure Selection
Choose the method by identifying parameter type, number of samples, design, and variable type.
Confidence Interval vs Hypothesis Test
Estimate a plausible parameter range with an interval, or evaluate a claim with a test.
One Proportion Z Procedures
Use for one population proportion; z-interval estimates it, z-test compares it to a claimed value.
One Sample T Procedures
Use for one population mean; t-interval estimates it, t-test compares it to a claimed value.
Two Proportion Z Procedures
Use for comparing two population proportions; z-interval estimates difference, z-test tests claimed difference.
Chi-Square Goodness of Fit Test
Tests whether one categorical variable's distribution matches a claimed distribution.
Chi-Square Test for Independence
Tests whether two categorical variables are associated in one population.
Chi-Square Test for Homogeneity
Tests whether categorical distributions are the same across multiple populations or treatments.
Linear Regression T Procedures
Use for slope inference in least-squares regression; interval estimates slope, test checks if slope equals zero.
How To Distinguish The Three Chi-Square Tests
Goodness of fit compares one distribution, independence checks association, homogeneity compares group distributions.
Categorical vs Quantitative Inference
Use z procedures for categorical proportions and t procedures for quantitative means.
Choosing Between Matched Pairs and Two-Sample T Procedures
Use paired differences for linked data and two-sample methods for independent groups.
Recognizing Regression Inference
Use slope inference for two quantitative variables, often using regression computer output.
