Topic 6.3 Notes – Justifying a Claim Based on a Confidence Interval for a Population Proportion
What a Confidence Interval for a Population Proportion Means
A confidence interval for a population proportion gives a range of plausible values for the true proportion in the population.
It is built from:
- A random sample
- The sample proportion
Because the interval is based on random data, it either:
- Does contain the true population proportion , or
- Does not contain it
There’s no probability attached to that specific interval after it’s created.
What the Confidence Level Actually Means
If we say we have a 95% confidence interval, that means:
In repeated random sampling with the same sample size, about 95% of the intervals constructed this way would capture the true population proportion.
The parameter is fixed.
The interval changes from sample to sample.
In repeated random sampling, each sample produces a different interval. Most of those intervals would capture the true population proportion; a small fraction would not. That long-run behavior is what “95% confident” refers to: the success rate of the method if we repeated it many times.
Also remember:
- Proportions must be between 0 and 1
- We are estimating the population proportion, not the sample proportion (we already know )
How to Correctly Interpret a Confidence Interval
To earn full credit, your interpretation must include:
- Confidence level
- Context
- Reference to the true population proportion
Correct Template
We are C% confident that the interval from ___ to ___ contains the true population proportion of [population in context] who [variable in context].
Example structure:
We are 95% confident that the interval from 0.41 to 0.52 contains the true population proportion of registered voters in the state who support the proposed tax increase.
Notice:
- It says true population proportion
- It names the population
- It includes the variable in context
Common Wrong Phrases
- “There is a 95% probability that p is in this interval.”
(The interval is random, not p.) - “95% of people are in this interval.”
(This is not about data values.) - Forgetting context.
On FRQs, leaving out context or saying “probability” instead of “confidence” costs points almost every year.
Using a Confidence Interval to Justify a Claim
A confidence interval can help you decide whether a claimed value is reasonable.
Step-by-Step Logic
- Identify the claimed proportion .
- Construct (or use) the confidence interval.
- Check whether is inside the interval.
Decision Rule
- If is inside the interval
→ The claim is plausible. - If is not inside the interval
→ The claim is not plausible. There is evidence the true proportion differs.
Picture this on a number line. The interval runs from 0.38 to 0.46, and the claimed value 0.50 sits to the right of that range.
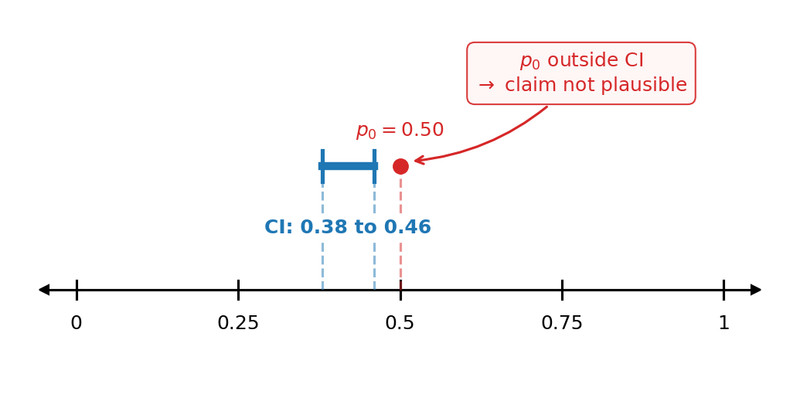
If 0.50 is outside (0.38, 0.46), that claim doesn’t look reasonable.
Your conclusion must be in context. For example:
Because 0.50 is not in the interval, there is convincing evidence that the true proportion of customers who prefer Brand A is different from 50%.
Avoid saying the claim is “true” or “false.” Statistics supports or does not support.
Large Counts Condition Adjustment
When you build the interval, check Large Counts with the sample proportion, even if a claimed value is given:
The claimed goes into this check only when you run a hypothesis test.
This switch trips people up on tests.
Sample Size, Confidence Level, Margin of Error, and Width
A one-sample proportion confidence interval looks like:
Width and Margin of Error
- Width = 2 × ME
- Bigger margin of error → wider interval.
Sample Size and Width
Width is proportional to .
As sample size increases, width decreases.
Bigger sample → less variability → more precision.
Confidence Level and Width
Higher confidence level → larger critical value → larger margin of error → wider interval.
Quick summary:
- Increase → narrower interval
- Increase confidence level → wider interval
- Width =
Conceptual multiple-choice questions love these relationships.
Key Takeaways
Confidence Interval Capture Meaning
A specific interval either contains the true population proportion or it does not.
Confidence Level in Repeated Sampling
In many random samples of the same size, about C% of intervals capture the true proportion.
Using a Confidence Interval to Evaluate a Claim About a Population Proportion
If the claimed proportion is inside the interval, the claim is plausible; if outside, doubt it.
Sample Size and Confidence Interval Width
Larger samples produce narrower intervals; width is proportional to 1 divided by the square root of n.
Confidence Level and Confidence Interval Width
For the same sample data, higher confidence levels produce wider intervals.
Margin of Error and Confidence Interval Width
The interval's width equals twice the margin of error.
Interpreting a Confidence Interval for a Population Proportion
State that you are C% confident the interval contains the true population proportion in context.
Notes
Confidence Interval Capture Meaning
A specific interval either contains the true population proportion or it does not.
Confidence Level in Repeated Sampling
In many random samples of the same size, about C% of intervals capture the true proportion.
Using a Confidence Interval to Evaluate a Claim About a Population Proportion
If the claimed proportion is inside the interval, the claim is plausible; if outside, doubt it.
Sample Size and Confidence Interval Width
Larger samples produce narrower intervals; width is proportional to 1 divided by the square root of n.
Confidence Level and Confidence Interval Width
For the same sample data, higher confidence levels produce wider intervals.
Margin of Error and Confidence Interval Width
The interval's width equals twice the margin of error.
Interpreting a Confidence Interval for a Population Proportion
State that you are C% confident the interval contains the true population proportion in context.
