Topic 6.6 Notes – Concluding a Test for a Population Proportion
1. What It Means to Conclude a Significance Test for a Population Proportion
At this point, you already have:
- Hypotheses (like , )
- A test statistic
- A p-value
Now you must decide whether the sample provides convincing evidence against .
Two ideas drive everything:
- The p-value is the probability of getting your result (or something more extreme) if the null hypothesis is true.
- The significance level is your cutoff for deciding what counts as “small.”
Your job is to:
- Compare p-value to
- Make a decision about
- State a conclusion about the true population proportion in context
This is the moment where statistical reasoning answers the research question.
2. The Significance Level α and the Decision Rule
What α Means
The significance level is:
That’s the probability of a Type I error.
If , you are accepting a 5% chance of rejecting a true null hypothesis.
Important details:
- It is chosen before looking at the data.
- Common values are 0.05, 0.01, and 0.10.
- Smaller means you require stronger evidence to reject .
The Formal Decision Rule
You must explicitly compare the numbers:
- If p-value ≤ → Reject
- If p-value > → Fail to reject
That comparison must appear in writing.
Correct phrasing:
Since the p-value (0.018) is less than , we reject .
Never say:
- “Accept ”
- “Prove the null”
- “Accept the alternative”
You only reject or fail to reject.
3. What the p-Value Is Actually Telling You
It helps to picture this on a normal curve. The shaded tail represents the p-value, which is the probability of getting a result at least as extreme as your observed statistic, assuming is true.
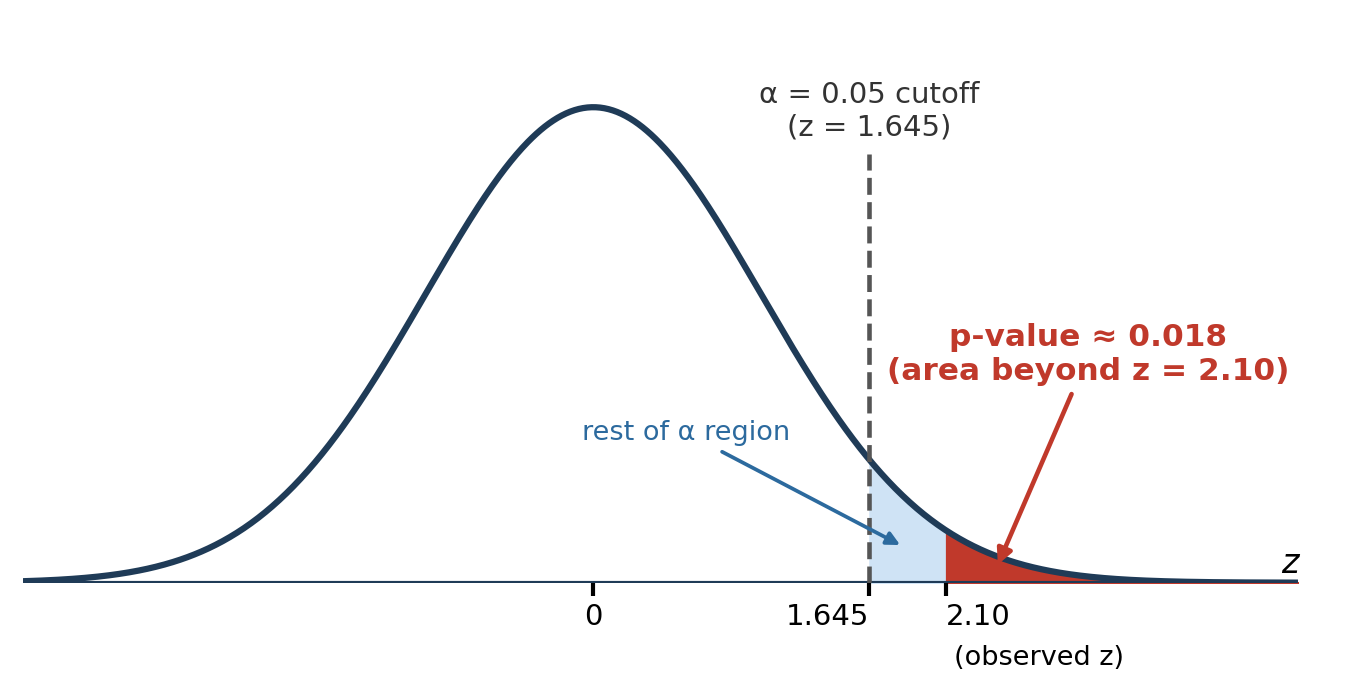
For a right-tailed test like with observed , the p-value is the dark red tail beyond 2.10 (about 0.018). It sits inside the region beyond 1.645, so p-value < and we reject .
Small p-values
A small p-value means:
- Your observed result would be unusual if were true.
- That gives evidence in favor of .
- The smaller the p-value, the stronger the statistical evidence against .
You’re basically saying:
“If the null were true, this result would be rare.”
Large (Not Small) p-values
A large p-value means:
- The result is not unusual under .
- There is not convincing evidence for the alternative.
Crucial distinction:
- Failing to reject does not mean it is true.
- It means you do not have strong enough evidence to support .
On AP free response, students lose points every year for writing something like “This proves the population proportion is 0.60.” That can never come from a significance test.
4. Writing the Full Conclusion in Context
Your conclusion has three required parts.
1. Compare p-value to
State the numbers clearly.
2. State the Decision
Reject or fail to reject .
3. Interpret in Context About the True Population Proportion
You must reference:
- The population
- The variable
- The alternative hypothesis
Here’s the structure you should internalize:
Since the p-value (____) is [less than/greater than] = ____, we [reject/fail to reject] . There is [sufficient/insufficient] statistical evidence to conclude that [state in context about the true population proportion].
Example (structure only):
There is sufficient statistical evidence to conclude that the true proportion of high school students who prefer later start times is greater than 0.50.
Notice:
- It says true proportion
- It references the actual population
- It matches the alternative hypothesis exactly
The conclusion is your statistical justification for answering the research question.
Key Takeaways
Significance Level (Alpha, α)
The predetermined probability of rejecting a true null hypothesis.
Reject vs. Fail to Reject
Reject means sufficient evidence for Ha; fail to reject means insufficient evidence for Ha.
Why You Never Accept the Null Hypothesis
Not rejecting H0 does not prove it true; it only shows weak evidence against it.
Small vs. Large P-Values
Small values give stronger evidence for Ha; larger values do not support Ha or prove H0.
Using a Z-Score to Conclude a Test
Large positive or negative z-values correspond to small p-values and possible rejection of H0.
Decision Rule and Statistical Significance
If the p-value is at most α, reject H0 as statistically significant; otherwise fail to reject.
Conclusion in Context
State the decision and whether there is evidence for the population proportion claim in context.
P-Value
The probability, assuming H0 is true, of getting the observed result or more extreme.
Notes
Significance Level (Alpha, α)
The predetermined probability of rejecting a true null hypothesis.
Reject vs. Fail to Reject
Reject means sufficient evidence for Ha; fail to reject means insufficient evidence for Ha.
Why You Never Accept the Null Hypothesis
Not rejecting H0 does not prove it true; it only shows weak evidence against it.
Small vs. Large P-Values
Small values give stronger evidence for Ha; larger values do not support Ha or prove H0.
Using a Z-Score to Conclude a Test
Large positive or negative z-values correspond to small p-values and possible rejection of H0.
Decision Rule and Statistical Significance
If the p-value is at most α, reject H0 as statistically significant; otherwise fail to reject.
Conclusion in Context
State the decision and whether there is evidence for the population proportion claim in context.
P-Value
The probability, assuming H0 is true, of getting the observed result or more extreme.
