Topic 6.5 Notes – Interpreting p-Values
1. What a p-Value Is
A p-value is the probability of getting a test statistic as extreme or more extreme than the one observed, assuming the null hypothesis is true.
Two pieces are always built in:
- We assume the null hypothesis is true (for a proportion test, that means ).
- We look at how unusual our sample result is in the null distribution.
The null distribution can come from:
- A randomization distribution (simulation-based), or
- A theoretical distribution like the normal (z) distribution when conditions are met.
For a one-sample proportion test:
- We assume the true proportion is .
- If and , the sampling distribution of is approximately normal.
So the p-value answers this question:
If the true population proportion were , how likely is a sample result this extreme?
Small p-value → data are unlikely under → stronger evidence against .
Large p-value → data are plausible under → weak evidence against .
2. The z-Test Statistic for a Population Proportion
Every test statistic follows the same structure:
For a one-sample proportion:
Where:
- = sample proportion
- = hypothesized proportion from
- = sample size
Notice the denominator uses , not . That’s because we are building the distribution assuming the null is true.
The z-score tells you how many standard deviations is from :
- Positive z →
- Negative z →
Once you have z, you use the normal distribution to find the p-value.
3. Finding the p-Value from the z-Statistic
The p-value is the area in the tail(s) of the standard normal curve beyond your observed z. The direction depends on the alternative hypothesis.
Right-tailed test
- p-value = area to the right of z
- We’re looking for unusually large sample proportions.
Left-tailed test
- p-value = area to the left of z
- We’re looking for unusually small sample proportions.
Two-tailed test
- p-value = area in both tails beyond ±|z|
- Double the one-tail area.
The graph below shows a left-tailed example, where the shaded region represents the area to the left of a given z-score.
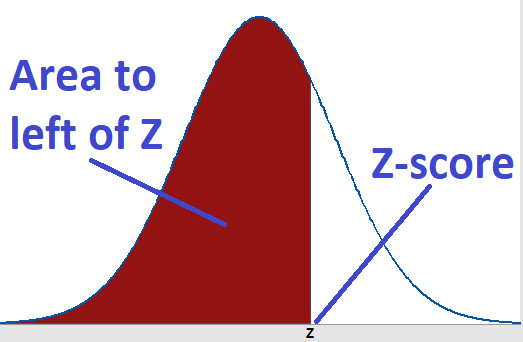
Left-tailed p-value on the standard normal curve
On multiple-choice questions, a common trap is doubling the area when the alternative is one-sided. Always check the direction of before finding area.
4. Interpreting the p-Value in Context
Your interpretation must include:
- A probability statement
- The phrase “assuming the null hypothesis is true”
- The real-world context
A strong AP-style sentence sounds like this:
Assuming the true proportion of seniors at this school who plan to attend college is 0.65, the probability of obtaining a sample proportion as extreme or more extreme than the one observed is 0.028.
That’s it. Clear and tied to the actual population.
Connecting to significance level
- If p-value ≤ → Reject
- If p-value > → Fail to reject
Rejecting means the data provide convincing evidence for the alternative.
Failing to reject means the data do not provide convincing evidence.
It does not mean the null is true.
5. Common Mistakes
- Saying the p-value is the probability that is true. We assume is true when calculating it.
- Forgetting “as extreme or more extreme.” The p-value includes more unusual outcomes than what you observed.
- Using in the standard deviation instead of .
- Giving a generic interpretation with no context. On free-response, missing context costs points immediately.
- Writing “there is a 3% chance the results happened by random chance.” That’s vague. Tie it to the null model and the specific proportion.
Key Takeaways
p-Value
The probability, assuming the null is true, of getting a result as extreme or more extreme.
Null Distribution
The distribution of possible test statistic values when the null hypothesis is assumed true.
Randomization Distribution vs. Theoretical Distribution
A simulated null distribution from repeated randomization versus a model-based z distribution under stated assumptions.
One-Sample z-Test for a Population Proportion
A significance test using a z statistic to compare a sample proportion to a hypothesized population proportion.
General Test Statistic Form
Observed statistic minus null parameter value, divided by the statistic's standard deviation under the null.
Tail Direction and p-Value
Use right-tail area for >, left-tail area for <, and both tails beyond |z| for ≠.
Assumption Behind a p-Value
It is computed under the assumption that the null hypothesis and probability model are true.
z-Statistic for a Population Proportion
The standardized difference between p-hat and p0 using sqrt(p0(1-p0)/n).
Interpreting p-Value Size
Small values give strong evidence against the null; large values give weak evidence.
Significance Level and Decision Rule
Reject H0 when the p-value is at most alpha; then the result is statistically significant.
Notes
p-Value
The probability, assuming the null is true, of getting a result as extreme or more extreme.
Null Distribution
The distribution of possible test statistic values when the null hypothesis is assumed true.
Randomization Distribution vs. Theoretical Distribution
A simulated null distribution from repeated randomization versus a model-based z distribution under stated assumptions.
One-Sample z-Test for a Population Proportion
A significance test using a z statistic to compare a sample proportion to a hypothesized population proportion.
General Test Statistic Form
Observed statistic minus null parameter value, divided by the statistic's standard deviation under the null.
Tail Direction and p-Value
Use right-tail area for >, left-tail area for <, and both tails beyond |z| for ≠.
Assumption Behind a p-Value
It is computed under the assumption that the null hypothesis and probability model are true.
z-Statistic for a Population Proportion
The standardized difference between p-hat and p0 using sqrt(p0(1-p0)/n).
Interpreting p-Value Size
Small values give strong evidence against the null; large values give weak evidence.
Significance Level and Decision Rule
Reject H0 when the p-value is at most alpha; then the result is statistically significant.
