Topic 2.5 Notes – Correlation
What Correlation r Is
When you look at a scatterplot, you judge two things:
- Do the points trend up or down?
- How tightly do they cluster around a line?
Correlation turns that visual judgment into a number.
Here’s what tells you:
- It measures the direction and strength of a linear association between two quantitative variables.
- It is always between −1 and 1, inclusive.
- → positive association (as x increases, y tends to increase).
- → negative association (as x increases, y tends to decrease).
- → no linear association.
- or → perfect linear relationship (all points lie exactly on a line).
- It is unit-free (because it’s based on standardized values).
- It is not resistant to outliers.
Think visually. The sign matches the slope direction. The closer the points are to a straight line, the closer is to 1.
Here’s a quick visual comparison of three different correlations:
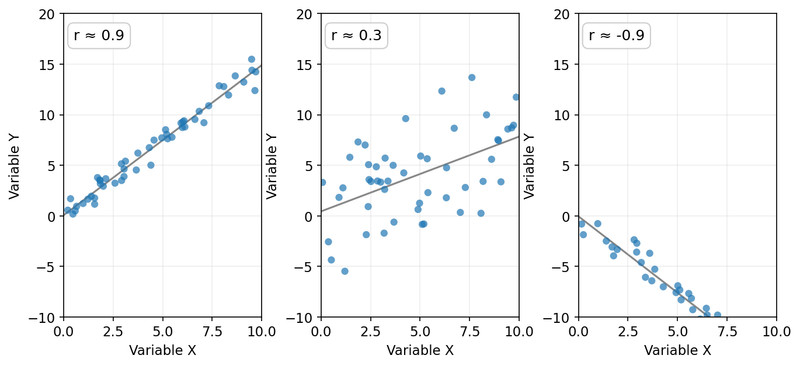
Scatterplots with strong positive, weak positive, and strong negative correlation
On the left, the points hug an upward-sloping line, so is close to 1. In the middle, the trend is positive but scattered, so is closer to 0. On the right, the points tightly follow a downward-sloping line, so is close to −1.
One important limitation shows up a lot on tests: r only measures linear relationships. A curved pattern can have a strong relationship but a small .
How to Determine Correlation
The formula
What’s happening conceptually:
- Each value is converted to a z-score (standardized using its mean and standard deviation).
- Pair the standardized x and y values.
- Multiply each pair.
- Average those products (divide by ).
Why this works:
- If x and y are often both above their means or both below, the products are positive → positive.
- If one tends to be above its mean when the other is below, products are negative → negative.
- If there’s no consistent pattern, positives and negatives cancel → near 0.
You almost never compute this by hand. On a TI-84:
- Enter x-values in L1, y-values in L2.
- Run LinReg(ax + b).
- Make sure Diagnostics On so you see .
Understanding what the formula represents matters more than memorizing the mechanics.
How to Interpret r in Context
An interpretation must include:
- Strength
- Direction
- The word linear
- The actual variables in context
Suppose for hours of sleep and reaction time.
A correct interpretation would sound like:
There is a strong negative linear association between hours of sleep and reaction time for the students in this study.
Notice:
- We didn’t say “r%.”
- We didn’t mention slope.
- We didn’t claim sleep causes reaction time changes.
Some rough guidelines for strength (no hard cutoffs):
- around 0.2 → weak
- around 0.5 → moderate
- 0.7 or higher → strong
On FRQs, leaving out “linear” or failing to name both variables can cost you.
What Correlation Does Not Tell You
Correlation is not causation
Even if is strong:
- There could be a lurking variable.
- The direction of influence could be reversed.
- The relationship could be coincidental.
Unless the data come from a well-designed experiment, you cannot say one variable causes the other.
r only measures linear association
You must look at the scatterplot.
In the example below, the points clearly follow a curved, U-shaped pattern. The linear correlation is about , which suggests almost no linear association, even though there is a very strong nonlinear relationship.
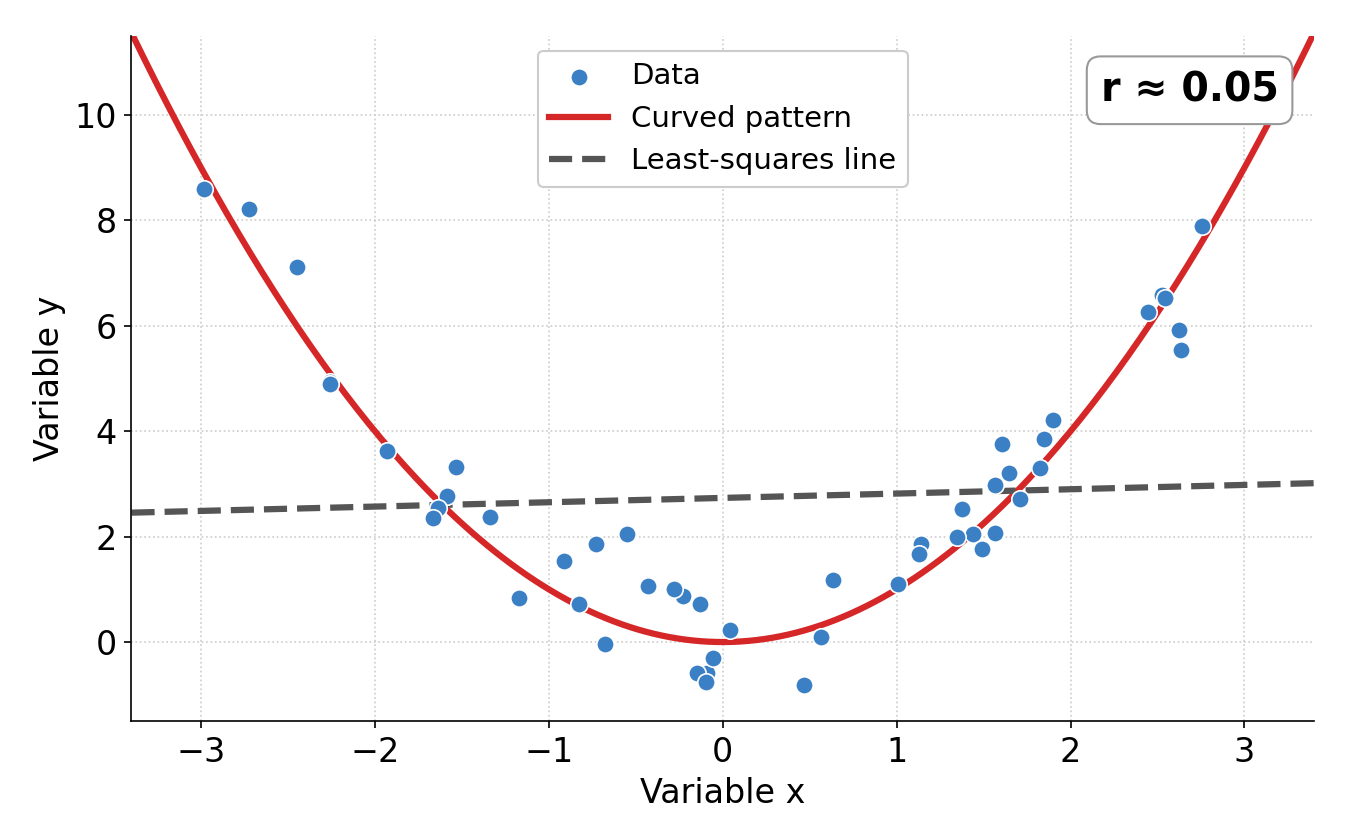
A strong curved (U-shaped) relationship whose least-squares line is almost flat, so
This is why AP questions often give you both a scatterplot and . Correlation only measures linear association. If the pattern is curved, a linear model is not appropriate, even if the relationship between the variables is clearly strong.
The reverse also happens: curved data, like steady exponential growth, can give or higher. A large alone does not prove the pattern is linear, so check the scatterplot (or a residual plot) before choosing a linear model.
r is not resistant
One extreme point, especially far in the x-direction, can dramatically change . If you see an outlier, mentally question how much it might be influencing the correlation.
Key Takeaways
Correlation Coefficient (r)
A number from -1 to 1 measuring the direction and strength of a linear relationship.
Special Correlation Values
r = 1 is perfect positive linear association, r = -1 perfect negative, and r = 0 no linear association.
Unit-Free Nature Of Correlation
It has no units because it is based on standardized values, not original measurement scales.
Correlation Formula
r = (1/(n - 1)) times the sum of paired x and y z-score products.
Technology For Finding Correlation
Use statistical software or a graphing calculator to compute r from paired quantitative data.
Correlation Measures Only Linear Association
It describes how closely points follow a straight-line pattern, not curved or other nonlinear patterns.
High Correlation Does Not Guarantee A Linear Model
A value near 1 or -1 can occur even when a curved pattern makes a linear model inappropriate.
Correlation And Causation
An association between two variables does not prove that one variable causes changes in the other.
Outliers And Correlation
Extreme points can strongly change the value because the calculation uses means and standard deviations.
Direction And Strength Of Correlation
The sign shows direction, and the size shows the strength of linear association.
Notes
Correlation Coefficient (r)
A number from -1 to 1 measuring the direction and strength of a linear relationship.
Special Correlation Values
r = 1 is perfect positive linear association, r = -1 perfect negative, and r = 0 no linear association.
Unit-Free Nature Of Correlation
It has no units because it is based on standardized values, not original measurement scales.
Correlation Formula
r = (1/(n - 1)) times the sum of paired x and y z-score products.
Technology For Finding Correlation
Use statistical software or a graphing calculator to compute r from paired quantitative data.
Correlation Measures Only Linear Association
It describes how closely points follow a straight-line pattern, not curved or other nonlinear patterns.
High Correlation Does Not Guarantee A Linear Model
A value near 1 or -1 can occur even when a curved pattern makes a linear model inappropriate.
Correlation And Causation
An association between two variables does not prove that one variable causes changes in the other.
Outliers And Correlation
Extreme points can strongly change the value because the calculation uses means and standard deviations.
Direction And Strength Of Correlation
The sign shows direction, and the size shows the strength of linear association.
