Topic 3.2 Notes – Introduction to Planning a Study
1. Population, Sample, and Census
Everything starts with knowing who you care about and who you actually measured.
Population
The population is the entire group of interest.
- Must be defined in context
- Who? (all seniors at Central High)
- Where? (in California)
- When? (during the 2025 school year)
- Described by parameters
- True mean
- True proportion
If a question says “all registered voters in Texas,” that’s the population. Say it clearly on FRQs:
“The population of interest is all registered voters in Texas in 2026.”
Sample
The sample is the subset you actually collect data from.
- Described by statistics
- Sample mean
- Sample proportion
- Used to estimate population parameters.
“The sample consists of the 850 registered voters in Texas who were surveyed.”
Students lose points by swapping these. Population = bigger group. Sample = the group with data.
Census
A census collects data from every individual in the population.
- No sampling variability
- Usually expensive and time-consuming
- Sometimes impossible (too large or changing constantly)
The big idea: how the sample is selected determines what you can say about the population.
2. Types of Studies
The fastest way to classify a study is one question:
Were treatments imposed?
Observational Study
Researchers observe and measure. They do not assign treatments.
- Retrospective → look back at existing records
- Prospective → follow subjects forward in time
- Can show an association between variables
- Cannot prove causation
A sample survey is a type of observational study:
- Uses questionnaires or interviews
- Goal is to learn about a population from a sample
If students report how many hours they sleep and their GPA, and you just analyze the data, that’s observational.
Experiment
Researchers impose treatments on subjects (experimental units).
- Subjects are assigned to different conditions
- Responses are compared across groups
- Can provide evidence of cause-and-effect (if well designed)
Here’s the basic structure you should picture in a randomized controlled experiment:
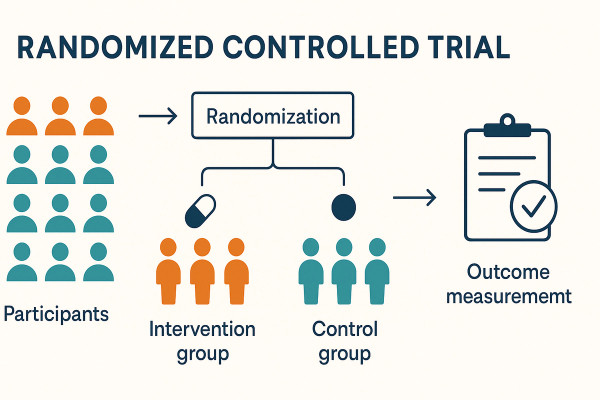
Randomized controlled trial structure
Participants are randomly assigned to an intervention (treatment) group or a control group, and then their outcomes are measured and compared.
If people are randomly assigned to drink either a caffeinated beverage or a placebo, that’s an experiment.
Quick test:
- Assigned to groups → Experiment
- Just measured as they are → Observational study
3. What You Can and Cannot Conclude
This is where most test questions live.
Generalizing to a Population
You can generalize to a population only if:
- The sample was randomly selected, or
- It is clearly representative of that population.
Also:
- You can only generalize to the population from which the sample was taken.
- A sample of one school ≠ all teenagers in the U.S.
If 200 randomly selected customers from one grocery store are surveyed, conclusions apply to customers of that store, not all shoppers everywhere.
AP graders look for precise language here.
Determining Cause and Effect
Observational study:
- Can say, “There is an association between screen time and sleep duration.”
- Cannot say screen time causes changes in sleep.
Experiment (with random assignment):
- Can say, “There is evidence that the treatment caused a change in reaction time.”
Why? Because random assignment helps balance lurking variables across groups.
No random assignment → no causation claim.
No random sampling → no broad generalization.
Keep those two ideas separate. Students mix them up constantly.
4. Confounding and Why Study Design Matters
Confounding happens when the effects of two variables on a response cannot be separated.
A variable is a confounder if it:
- Is related to the explanatory variable
- Affects the response variable
Example structure:
- Explanatory variable → exercise level
- Response variable → blood pressure
- Possible confounder → age
- Age affects blood pressure
- Age may be related to exercise habits
Now you cannot tell whether exercise or age explains the difference.
Observational studies are especially vulnerable to confounding because nothing is controlled.
Random assignment in experiments reduces confounding by spreading lurking variables across groups.
On multiple choice questions, if several answer choices could plausibly influence both variables, they can all be confounders. Don’t overthink it.
Key Takeaways
Population
All individuals or items of interest in a statistical study.
Sample
A subset of the population from which data are actually collected.
Census
A study that collects data from every individual in the population.
Observational Study
A study that records variables without imposing treatments on individuals.
Retrospective vs. Prospective Observational Study
Retrospective examines existing past data; prospective follows subjects forward while collecting future data.
Sample Survey
An observational study that gathers data from a sample to learn about its population.
Experiment
A study that imposes treatments by assigning subjects or units to conditions.
Treatment
A specific experimental condition imposed on subjects or experimental units.
Experimental Units / Subjects
The individuals or items to which treatments are assigned in an experiment.
Association vs. Causation
Association is a relationship between variables; causation means changes in one directly produce changes in another.
Confounding
When two variables' effects on a response are mixed so their separate influences cannot be distinguished.
Generalizability
The extent to which sample results can reasonably be applied to a population.
Representative Sample
A sample that accurately reflects important characteristics of the population of interest.
Population of Generalization
The population to which study results may be applied, limited to the population sampled.
Random Sample
A sample chosen by chance so each population member has a known selection probability.
Notes
Population
All individuals or items of interest in a statistical study.
Sample
A subset of the population from which data are actually collected.
Census
A study that collects data from every individual in the population.
Observational Study
A study that records variables without imposing treatments on individuals.
Retrospective vs. Prospective Observational Study
Retrospective examines existing past data; prospective follows subjects forward while collecting future data.
Sample Survey
An observational study that gathers data from a sample to learn about its population.
Experiment
A study that imposes treatments by assigning subjects or units to conditions.
Treatment
A specific experimental condition imposed on subjects or experimental units.
Experimental Units / Subjects
The individuals or items to which treatments are assigned in an experiment.
Association vs. Causation
Association is a relationship between variables; causation means changes in one directly produce changes in another.
Confounding
When two variables' effects on a response are mixed so their separate influences cannot be distinguished.
Generalizability
The extent to which sample results can reasonably be applied to a population.
Representative Sample
A sample that accurately reflects important characteristics of the population of interest.
Population of Generalization
The population to which study results may be applied, limited to the population sampled.
Random Sample
A sample chosen by chance so each population member has a known selection probability.
