Topic 7.3 Notes – Justifying a Claim About a Population Mean Based on a Confidence Interval
What a confidence interval for a population mean means
When you build a confidence interval for a mean, you are estimating an unknown population mean using sample data.
For a single mean, the interval has the form:
For matched pairs (like before-and-after data), you compute differences first and estimate the population mean difference :
What the interval is saying
Each interval you calculate either:
- contains the true population mean, or
- does not contain it
There is no probability attached after the interval is created. The randomness happened when you took the sample.
When we say we are C% confident, we mean:
If we repeatedly took many random samples of the same size and built intervals the same way, about C% of those intervals would capture the true population mean.
Here’s the picture behind that idea. The dashed vertical line represents the true population mean . Each horizontal segment is a confidence interval from a different random sample.
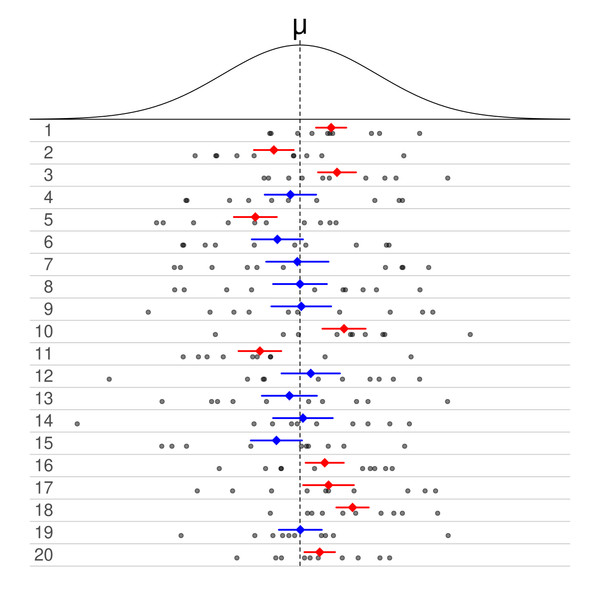
Repeated confidence intervals and the true mean
This picture uses 50% intervals, so only about half of them (the blue ones) cross the dashed line and contain ; the red ones miss it. With 95% intervals, about 95% would capture it. That’s what confidence means.
How to interpret in context
An interpretation must:
- State the confidence level.
- Name the population parameter (mean or mean difference).
- Refer to the population in context.
Correct example structure:
We are 95% confident that the true mean battery life of all smartphones produced at this factory is between 9.8 and 10.6 hours.
For matched pairs:
We are 95% confident that the true mean decrease in resting heart rate after the 8-week training program is between 3 and 6 beats per minute.
Never say:
- “There is a 95% probability that μ is in this interval.”
- “95% of the data are in this interval.”
- “We are 95% confident the sample mean is in the interval.” (We already know where the sample mean is.)
Using a confidence interval to justify a claim about μ
Usually a claim gives a specific value, like .
The confidence interval gives you a range of plausible values for the true mean.
Decision rule
- If the claimed value is inside the interval
→ The claim is plausible.
The data are consistent with it. - If the claimed value is outside the interval
→ You have evidence the true mean is different from the claim.
This matches a two-sided hypothesis test at the same level:
- 95% confidence ↔
If the claimed value is not in a 95% CI, you would reject at the 0.05 level.
Matched pairs special case
The key value to check is 0.
- If 0 is in the interval for
→ No convincing evidence of a difference. - If 0 is not in the interval
→ Convincing evidence of a difference.
When writing a conclusion, mention:
- The interval.
- Whether the claim value is inside or outside.
- The population, in context.
Example conclusion:
Because 72 inches is not contained in the 95% confidence interval, there is convincing evidence that the true mean height of all plants grown with the new fertilizer differs from 72 inches.
Avoid dramatic wording like “proves.” AP readers want “evidence,” not certainty.
What controls the width of the interval
The width is:
Margin of error is:
Three things affect it.
1. Sample size
As increases:
- decreases.
- gets slightly smaller (higher degrees of freedom).
Result → Larger sample size gives a narrower interval.
Width is proportional to .
If you multiply by 4, the width is cut in half.
2. Confidence level
Higher confidence → larger → larger margin of error.
Result → Higher confidence gives a wider interval.
3. Sample variability
More variability in the data → larger standard error.
Result → More spread in data gives a wider interval.
Put those three ideas together in one snapshot:
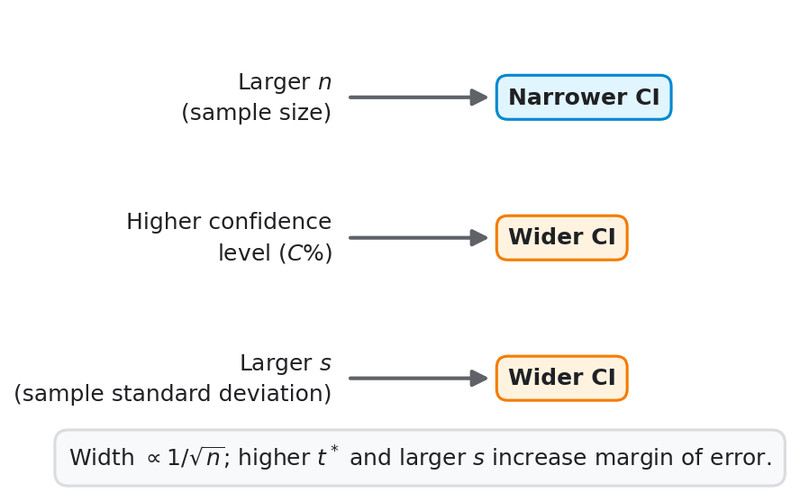
How , confidence level, and affect CI width
On multiple choice, they love changing just one of these and asking what happens to width. Track which piece of the formula changed.
Key Takeaways
Correct Contextual Interpretation of a Confidence Interval
State the confidence level, parameter, population, and that the interval came from a sample.
Matched Pairs Mean Difference Confidence Interval
An interval estimating the population mean of pairwise differences from dependent observations.
Confidence Level and Confidence Interval Width
Higher confidence levels produce wider intervals for the same sample data.
Margin of Error for a Mean
The distance from the sample mean to either endpoint, equal to critical value times standard error.
Standard Error for a Mean
The estimated spread of sample means, calculated as s divided by the square root of n.
t Critical Value for a Mean Interval
The cutoff from the t distribution based on confidence level and degrees of freedom.
Degrees of Freedom for One-Sample t Procedures
For one sample mean, the value is n minus 1.
One-Sample t Interval Formula
Sample mean plus or minus t star times s over square root of n.
Interpreting a Confidence Interval for a Population Mean
We are C% confident this sample-based interval captures the true population mean.
Using a Confidence Interval to Evaluate a Claim About a Population Mean
A claimed mean is supported if inside the interval and not supported if outside.
Sample Size and Confidence Interval Width
For one mean, larger samples give narrower intervals because width is proportional to 1/√n.
Notes
Correct Contextual Interpretation of a Confidence Interval
State the confidence level, parameter, population, and that the interval came from a sample.
Matched Pairs Mean Difference Confidence Interval
An interval estimating the population mean of pairwise differences from dependent observations.
Confidence Level and Confidence Interval Width
Higher confidence levels produce wider intervals for the same sample data.
Margin of Error for a Mean
The distance from the sample mean to either endpoint, equal to critical value times standard error.
Standard Error for a Mean
The estimated spread of sample means, calculated as s divided by the square root of n.
t Critical Value for a Mean Interval
The cutoff from the t distribution based on confidence level and degrees of freedom.
Degrees of Freedom for One-Sample t Procedures
For one sample mean, the value is n minus 1.
One-Sample t Interval Formula
Sample mean plus or minus t star times s over square root of n.
Interpreting a Confidence Interval for a Population Mean
We are C% confident this sample-based interval captures the true population mean.
Using a Confidence Interval to Evaluate a Claim About a Population Mean
A claimed mean is supported if inside the interval and not supported if outside.
Sample Size and Confidence Interval Width
For one mean, larger samples give narrower intervals because width is proportional to 1/√n.
