Topic 8.4 Notes – Expected Counts in Two-Way Tables
Two-Way Tables and What “Expected” Means
A two-way table organizes counts for two categorical variables.
- Rows = one categorical variable
- Columns = another categorical variable
- Each cell = number of individuals in that category combination
The numbers you collect from data are called observed counts (O).
An expected count (E) is what we would expect in a cell if the null hypothesis were true.
- For a test of independence → assume the variables are independent.
- For a test of homogeneity → assume the distributions are the same across groups.
Expected counts are not guesses. They come from a formula that builds the table under the assumption of no relationship.
The Expected Count Formula
For any cell in a two-way table:
Where:
- Row Total = total for that row
- Column Total = total for that column
- Table Total = grand total
This formula is required. You won’t get credit for “estimating” from proportions unless you show the actual calculation.
Why This Formula Makes Sense
If two variables are independent, then:
- The proportion in each column should be the same across rows.
- The marginal totals (row and column totals) control how the data is distributed.
The formula combines:
- How big the row is
- How big the column is
- How big the whole sample is
It spreads counts proportionally, assuming no association.
Step-by-Step Example
Suppose a survey of 200 students recorded:
- Whether they prefer online or in-person classes
- Whether they are freshmen or seniors
Here are the observed counts from the survey:
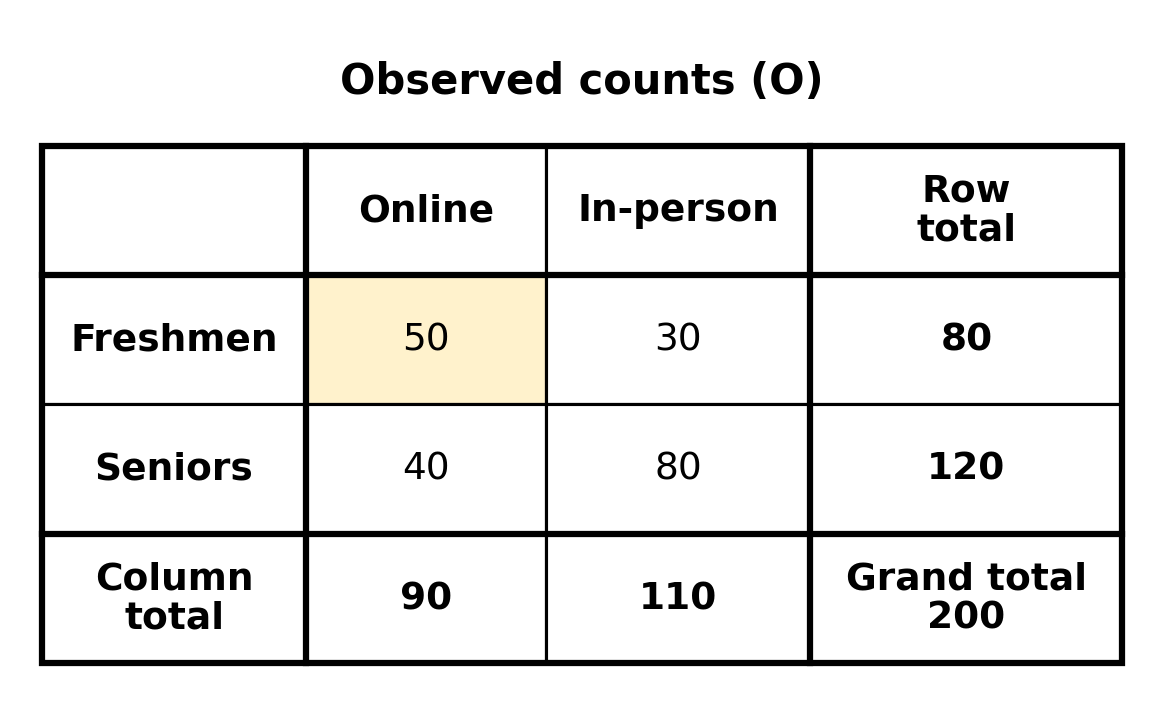
Observed two-way table of class preference by year. Row totals (80, 120) are on the right; column totals (90, 110) are along the bottom.
Let’s find the expected count for Freshmen who prefer Online.
- Row total (Freshmen) = 80
- Column total (Online) = 90
- Table total = 200
So if class preference and year in school were independent, we would expect 36 freshmen to prefer online classes.
The observed count in that cell is 50. That difference is what feeds into the chi-square statistic later.
You repeat this process for every cell in the table.
Independence vs Homogeneity
Both tests use the same expected count formula. The difference is context.
| Independence | Homogeneity | |
|---|---|---|
| Populations | One population | Two or more populations |
| Variables | Two categorical variables | One categorical variable compared across groups |
| Null hypothesis | Variables are independent | Distributions are the same |
| Expected count formula | Same formula | Same formula |
AP questions love to describe the scenario in words and make you decide which situation it is. Once you’re computing expected counts, the math is identical.
How Expected Counts Connect to Chi-Square
The chi-square statistic is:
- = observed count
- = expected count
Each cell contributes a piece. Big differences between observed and expected lead to a large value.
Expected counts are the “model” under the null hypothesis. The entire test is measuring how far reality deviates from that model.
Conditions Reminder
For chi-square procedures:
- All expected counts must be at least 5.
- This rule is about expected counts, not observed counts.
Students often check the wrong numbers here.
Common Mistakes to Avoid
- Using the observed count inside the formula instead of the row and column totals.
- Forgetting to divide by the grand total.
- Only calculating one expected count when the problem requires all of them.
- Writing the formula but not plugging in actual numbers. On FRQs, you must show the substitution.
When you compute expected counts correctly, the row totals and column totals will still match the original margins. If they don’t, something went wrong in the arithmetic.
Key Takeaways
Expected Count in a Two-Way Table
The predicted cell frequency if row and column variables are independent or distributions are the same.
Expected Count Formula
Multiply the row total by the column total, then divide by the table total.
Expected Counts Matrix
A table of expected frequencies found by applying the expected count formula to every cell.
Chi-Square Test for Homogeneity
Compares one categorical variable's distribution across two or more independent populations or groups.
Chi-Square Test for Independence
Tests whether two categorical variables are associated within a single population.
Notes
Expected Count in a Two-Way Table
The predicted cell frequency if row and column variables are independent or distributions are the same.
Expected Count Formula
Multiply the row total by the column total, then divide by the table total.
Expected Counts Matrix
A table of expected frequencies found by applying the expected count formula to every cell.
Chi-Square Test for Homogeneity
Compares one categorical variable's distribution across two or more independent populations or groups.
Chi-Square Test for Independence
Tests whether two categorical variables are associated within a single population.
