Topic 8.3 Notes – Carrying Out a Chi-Square Test for Goodness of Fit
1. The Chi-Square Test Statistic for Goodness of Fit
A chi-square goodness of fit test compares:
- Observed counts (O) from your sample
- Expected counts (E) based on a claimed population distribution (your null model)
The test statistic is:
Where:
- = observed count in a category
- = expected count in that category
- You add up the value for all categories.
What each part is doing
Each term :
- Measures how far one category’s data is from what was predicted.
- Squaring makes all differences positive.
- Dividing by adjusts for category size. A difference of 10 matters more if you expected 20 than if you expected 500.
Because everything is squared, χ² is always 0 or larger.
- χ² near 0 → observed counts are close to expected → supports
- Large χ² → big differences → evidence against
Degrees of freedom
If you have 5 categories, then .
What the null distribution looks like
If the null hypothesis (and its probability model) is true, the test statistic follows a chi-square distribution with the appropriate .
Here are several chi-square distributions for different degrees of freedom.
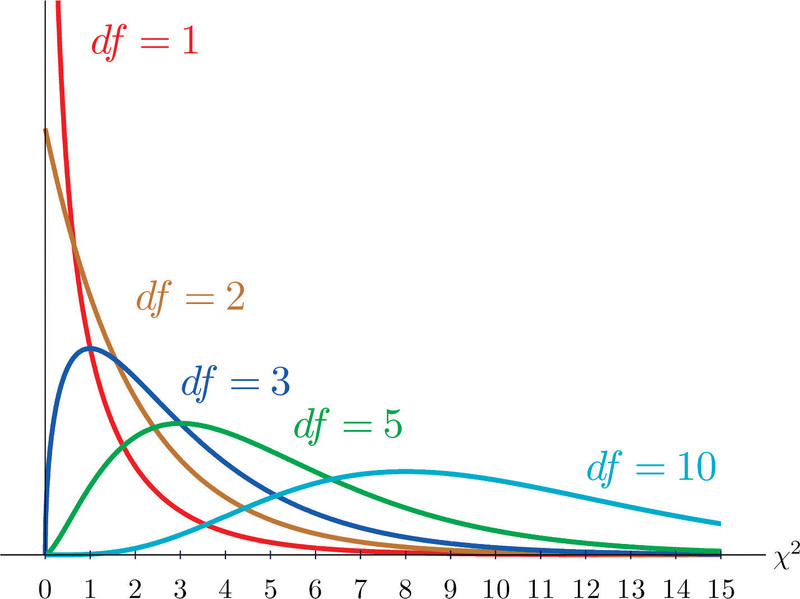
Chi-square distributions for different degrees of freedom
Key features:
- Only defined for values ≥ 0
- Right-skewed
- Larger → more spread out and more symmetric
As increases, the curve shifts to the right and becomes less skewed, but it always stays nonnegative and right-skewed.
In some settings, a randomization distribution could be used instead of the theoretical chi-square curve, but on the AP exam you’ll almost always use the chi-square distribution.
2. Calculating the Chi-Square Statistic
Here’s what this looks like in action.
Imagine a company claims customer preferences are:
- 50% Product A
- 30% Product B
- 20% Product C
You survey 200 customers and observe:
- A: 88
- B: 74
- C: 38
Step-by-step
Find expected counts
- A:
- B:
- C:
Compute each component
Degrees of freedom
Using technology
On a calculator: use χ²GOF-Test, enter:
- Observed list
- Expected list
It gives you χ², , and the p-value.
Common mistakes I see every year:
- Plugging in proportions instead of counts
- Forgetting to square
- Using the wrong
3. Finding and Interpreting the p-Value
Once you have χ² and , the p-value is:
The probability, assuming the null hypothesis and its probability model are true, of getting a chi-square statistic as large or larger than the one observed.
Because the chi-square distribution is right-skewed:
- The p-value is the area to the right of your χ² value.
Large χ² → small p-value → stronger evidence against .
You can:
- Use calculator output (best option), or
- Use a chi-square table with the correct .
Interpreting the p-value in context
Your interpretation must include:
- “Assuming the null hypothesis is true”
- The test statistic (or “a chi-square statistic”)
- The numeric p-value
- The real-world context
Example:
If the company’s claimed distribution is correct, the probability of getting a chi-square statistic of 4.81 or larger from a sample of 200 customers is 0.09.
Never say:
- “There is a 9% chance the null is true.”
- “There is a 9% chance the results happened by chance.”
4. Making a Decision and Stating the Conclusion
Compare the p-value to your significance level .
- If p ≤ α → Reject
- If p > α → Fail to reject
Never say “accept .”
Writing the conclusion
You need:
- Decision
- “Convincing evidence”
- Population + variable in context
If p = 0.09 and α = 0.05:
Since 0.09 > 0.05, we fail to reject the null hypothesis. There is not convincing evidence that the true distribution of customer preferences differs from the company’s claimed distribution.
Big picture meaning:
- A significant result means at least one category proportion is different.
- The test does not tell you which one.
- A non-significant result means the data are consistent with the claimed distribution, not that it’s proven correct.
Key Takeaways
Chi-Square Test Statistic for Goodness of Fit
Sum (Observed minus Expected) squared divided by Expected across all categories.
Degrees of Freedom for Chi-Square Goodness of Fit
Number of categories minus 1.
Null Distribution for Chi-Square Goodness of Fit
The distribution of test statistics expected if the null hypothesis and probability model are true.
Randomization Distribution vs. Theoretical Chi-Square Distribution
Use simulation under the null or use a chi-square model when a probability model is assumed true.
P-Value for Chi-Square Goodness of Fit
Probability, assuming the null is true, of getting a chi-square statistic at least as large observed.
Finding the P-Value for a Chi-Square Goodness of Fit Test
Use the chi-square table or computer output with the test statistic and degrees of freedom.
Right-Tailed Nature of the Chi-Square Goodness of Fit Test
Larger chi-square values show greater disagreement between observed and expected counts, so only the right tail matters.
Decision Rule Using P-Value and Alpha
Reject the null if p-value is less than alpha; otherwise fail to reject it.
Chi-Square Goodness of Fit Conclusion
State whether to reject or fail to reject and interpret the result in context.
Notes
Chi-Square Test Statistic for Goodness of Fit
Sum (Observed minus Expected) squared divided by Expected across all categories.
Degrees of Freedom for Chi-Square Goodness of Fit
Number of categories minus 1.
Null Distribution for Chi-Square Goodness of Fit
The distribution of test statistics expected if the null hypothesis and probability model are true.
Randomization Distribution vs. Theoretical Chi-Square Distribution
Use simulation under the null or use a chi-square model when a probability model is assumed true.
P-Value for Chi-Square Goodness of Fit
Probability, assuming the null is true, of getting a chi-square statistic at least as large observed.
Finding the P-Value for a Chi-Square Goodness of Fit Test
Use the chi-square table or computer output with the test statistic and degrees of freedom.
Right-Tailed Nature of the Chi-Square Goodness of Fit Test
Larger chi-square values show greater disagreement between observed and expected counts, so only the right tail matters.
Decision Rule Using P-Value and Alpha
Reject the null if p-value is less than alpha; otherwise fail to reject it.
Chi-Square Goodness of Fit Conclusion
State whether to reject or fail to reject and interpret the result in context.
