Topic 3.7 Notes – Inference and Experiments
1. Statistical Inference in Experiments
What statistical inference does
Statistical inference uses data from a sample or experiment to say something about a larger population or the distribution that produced the data.
In an experiment, we usually compare treatment groups and ask:
- Is the difference in outcomes just random variation?
- Or is it evidence that the treatment actually had an effect?
Here’s the key mindset: we never assume our observed difference is the full truth. We recognize that a different random sample or different random assignment would give slightly different results.
That idea is called sampling variability.
Sampling variability and sampling error
Sampling variability
Natural differences in results from one random sample (or one random assignment) to another.Sampling error
The difference between a sample statistic (like a sample mean) and the true population parameter.
Even if a treatment has no real effect, two randomly assigned groups won’t have identical means. Randomness alone creates small differences.
As sample size increases:
- Variability decreases
- Estimates become more precise
- It becomes easier to detect real effects
Inference always accounts for the fact that we saw just one outcome from a random process.
Big idea: our conclusions are about the process that generated the data, not just the specific numbers we observed.
2. Why Random Assignment Allows Cause and Effect
Random assignment to treatments
In a true experiment, experimental units are randomly assigned to treatment groups.
That does something powerful:
- It balances lurking variables on average
- It makes the groups comparable before treatment
Here’s the structure of a simple randomized experiment. Notice how all subjects are randomly split into a control group and a treatment group, then their results are compared:
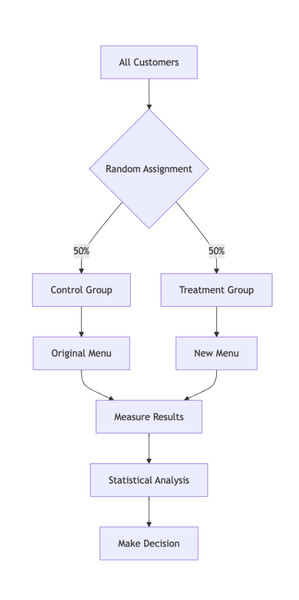
Basic structure of a randomized experiment
Because the groups start out similar due to random assignment, any large difference in response is likely due to the treatment.
Statistical significance
A difference is statistically significant if it would be very unlikely to occur just by chance if the treatment had no effect.
So when we say a result is statistically significant, we’re saying:
This difference is too large to reasonably attribute to random assignment alone.
In a well-designed experiment:
- Statistically significant difference → evidence of causation
If there is no random assignment, you cannot claim cause and effect. You can only say there is an association.
Common mistakes
- Saying “there is a relationship” when random assignment allows you to say the treatment caused the change.
- Claiming causation from an observational study.
- Ignoring whether the result was statistically significant before claiming an effect.
On free-response questions, you lose points fast if you ignore the design.
3. Generalizing Results to a Larger Population
Now shift from causation to generalization.
Random selection vs random assignment
| Random Assignment | Random Selection |
|---|---|
| Subjects randomly assigned to treatments | Subjects randomly chosen from a population |
| Allows cause-and-effect conclusions | Allows generalization to a population |
| Balances lurking variables | Makes sample representative (more likely) |
If you have:
- Random assignment only → Can claim causation, but only for those studied.
- Random selection only → Can generalize, but cannot claim causation.
- Both → Can claim cause and effect for the larger population.
- Neither → Very limited conclusions.
When writing conclusions, you must reference the design directly:
- “Because subjects were randomly assigned…”
- “Because subjects were randomly selected…”
4. How to Interpret Results of a Well-Designed Experiment
When you see a study description, think through it in order:
- Is this an experiment? (Were treatments imposed?)
- Was there random assignment? → Can I claim causation?
- Was there random selection? → Can I generalize?
- Was the difference statistically significant?
- State the conclusion in context.
A full-credit conclusion sounds like:
Because the subjects were randomly assigned to the new fertilizer or standard fertilizer, and the difference in mean plant height was statistically significant, there is convincing evidence that the new fertilizer caused greater average plant growth for these plants.
Notice:
- It names the treatments.
- It names the response variable.
- It ties causation to random assignment.
Avoid statements like “There is a 95% chance the treatment works.” Parameters are fixed. Probability statements refer to the method, not whether something is “true.”
Key Takeaways
Statistical Inference
Using sample or experimental data to draw conclusions about a population or distribution.
Sampling Variability
Different random samples from the same population produce different statistic values by chance.
Sampling Error
The difference between a sample statistic and the true population parameter.
Random Assignment
Using chance to place experimental units into treatment groups.
Statistically Significant
An observed difference so large that random chance alone is unlikely to explain it.
Cause and Effect in Experiments
A causal conclusion is justified when a well-designed experiment uses random assignment.
Random Selection vs. Random Assignment
Random selection supports generalization; random assignment supports cause-and-effect conclusions.
Random Selection and Representativeness
Using chance to choose units increases the likelihood that a sample reflects the population.
Generalizability
Applying study results to a larger population is more credible with representative, sufficiently large samples.
Notes
Statistical Inference
Using sample or experimental data to draw conclusions about a population or distribution.
Sampling Variability
Different random samples from the same population produce different statistic values by chance.
Sampling Error
The difference between a sample statistic and the true population parameter.
Random Assignment
Using chance to place experimental units into treatment groups.
Statistically Significant
An observed difference so large that random chance alone is unlikely to explain it.
Cause and Effect in Experiments
A causal conclusion is justified when a well-designed experiment uses random assignment.
Random Selection vs. Random Assignment
Random selection supports generalization; random assignment supports cause-and-effect conclusions.
Random Selection and Representativeness
Using chance to choose units increases the likelihood that a sample reflects the population.
Generalizability
Applying study results to a larger population is more credible with representative, sufficiently large samples.
