Topic 5.5 Notes – Sampling Distributions for Sample Proportions
What a Sampling Distribution of p̂ Is
When you take one random sample from a population and calculate a sample proportion,
that’s just one number.
Now imagine taking many independent random samples of the same size from the same population and calculating each time. The distribution of all those possible values is the sampling distribution of .
Important distinction:
- The original data are categorical (success/failure).
- The random variable in this topic is the proportion .
- The population proportion is fixed.
- The sample proportion varies from sample to sample.
Here’s what that idea looks like visually. A population with leads to different sample proportions like 0.36, 0.39, and 0.42, and those values form a distribution centered at 0.40.
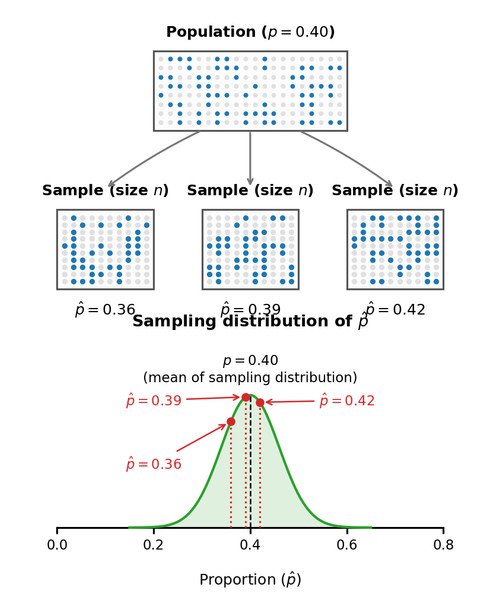
From population proportion to sampling distribution of
Even though individual responses are 0 or 1, the distribution of follows predictable probability rules. That’s the big idea.
Mean and Standard Deviation of p̂
Assume independent sampling (either sampling with replacement or sampling without replacement but meeting the 10% condition).
Mean
The sampling distribution is centered at the true population proportion.
This means is an unbiased estimator of . On average, sample proportions land at the true value.
Standard Deviation
This tells you how much typically varies from sample to sample.
What affects it?
- Larger → smaller standard deviation → less variability
- When , variability is largest
- As gets closer to 0 or 1, variability shrinks
In context, you would say:
The standard deviation of the sample proportion is 0.03, meaning sample proportions typically differ from the true population proportion by about 0.03.
Notice the units are proportions, not individuals.
Sampling Without Replacement and the 10% Condition
If sampling without replacement, the true standard deviation is slightly smaller than the formula above.
We ignore that difference if:
This is the 10% condition, and it lets us treat observations as approximately independent.
Students often forget this condition on quizzes. If the population size is given, check it.
When the Sampling Distribution Is Approximately Normal
Even though the data are categorical, the distribution of can look normal if the sample is large enough.
Large Counts Condition
We need:
Both the expected number of successes and failures must be at least 10.
If this condition is met:
- Shape ≈ Normal
- Center =
- Spread =
The grid below shows sampling distributions of for different values of (rows) and increasing sample sizes (columns). As you move to the right, the distributions become more symmetric and bell-shaped.
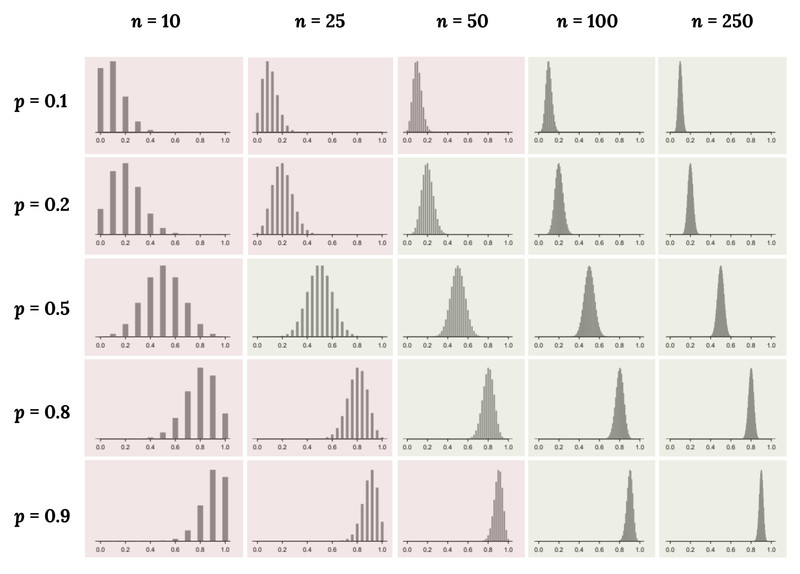
Sampling distributions of for different values of and
When is small or when is close to 0 or 1, the distributions are skewed. As increases and the large counts condition is satisfied, the shape becomes approximately normal.
Common issue: Students say “n is large” without checking and . For proportions, you must check both.
Interpreting Probabilities About p̂
When the distribution is approximately normal, we can compute probabilities using z-scores.
The standardized value is:
Important:
- We calculate probabilities about .
- The population proportion does not change.
Example of interpretation:
The probability that the sample proportion of voters who support the policy is greater than 0.55 is 0.08. This means that in repeated random samples of size 200, about 8% of sample proportions would exceed 0.55.
Always mention:
- The population
- The sample size
- That we’re talking about repeated random samples
That’s exactly how AP graders want it phrased.
Key Takeaways
Sampling Distribution of a Sample Proportion
The distribution of possible p-hat values from many repeated random samples of size n.
Mean and Standard Deviation of p-hat
Mean equals p; standard deviation equals sqrt(p(1-p)/n) for independent samples.
10% Condition for Sample Proportions
When sampling without replacement, n should be less than 10% of the population size.
Sampling Without Replacement Effect
Without replacement, variability is slightly smaller than sqrt(p(1-p)/n).
Approximate Normal Distribution of p-hat
If large counts are met, p-hat is approximately normal in repeated sampling.
Interpreting Parameters and Probabilities for p-hat
Describe center, spread, or probability using proportions and the specific population context.
Large Counts Condition
Approximate normality requires at least 10 expected successes and 10 expected failures.
Sample Proportion
The proportion of successes in a sample, written as p-hat.
Notes
Sampling Distribution of a Sample Proportion
The distribution of possible p-hat values from many repeated random samples of size n.
Mean and Standard Deviation of p-hat
Mean equals p; standard deviation equals sqrt(p(1-p)/n) for independent samples.
10% Condition for Sample Proportions
When sampling without replacement, n should be less than 10% of the population size.
Sampling Without Replacement Effect
Without replacement, variability is slightly smaller than sqrt(p(1-p)/n).
Approximate Normal Distribution of p-hat
If large counts are met, p-hat is approximately normal in repeated sampling.
Interpreting Parameters and Probabilities for p-hat
Describe center, spread, or probability using proportions and the specific population context.
Large Counts Condition
Approximate normality requires at least 10 expected successes and 10 expected failures.
Sample Proportion
The proportion of successes in a sample, written as p-hat.
