Topic 7.8 Notes – Setting Up a Test for the Difference of Two Population Means
Choosing the Correct Test
We are comparing two population means. That immediately tells you a few things.
- The variable must be quantitative (heights, times, scores, weights, etc.).
- There are two independent groups.
- The parameter of interest is
Because the population standard deviations are unknown, we use the t-distribution.
The correct name on the AP exam:
Two-sample t-test for a difference in two population means
If you see:
- Two separate random samples → likely two-sample t-test
- Random assignment to two treatments → also two-sample t-test
- Same individuals measured twice → that is paired t-test, not this topic
Independence between the two groups is essential. If the data are matched (like before/after on the same people), stop. That is a different procedure.
Writing Hypotheses for μ₁ − μ₂
Everything revolves around the difference in population means.
Always define your parameters in context first. For example:
- = true mean recovery time for patients given Drug A
- = true mean recovery time for patients given Drug B
Now write hypotheses about μ, not about sample means.
Null Hypothesis
The null always states equality.
This is equivalent to writing:
On the AP exam, writing it as a difference (μ₁ − μ₂ = 0) helps keep your work consistent with the test statistic later.
Alternative Hypothesis
This depends entirely on the research question.
- Two-sided (different)
- Right-tailed (group 1 larger)
- Left-tailed (group 1 smaller)
Match the direction to the wording. If the question says “is there a difference,” use ≠. If it says “is Group 1 higher,” use >.
Common mistakes that cost points:
- Using instead of
- Forgetting to define μ₁ and μ₂
- Choosing a one-sided test when the question asks “different”
Conditions for a Two-Sample t-Test
Before doing inference, you must check that it is appropriate to use a t-model. There are two big ideas: independence and approximately normal sampling distribution.
1. Independence
We need independence within each sample and between samples.
Within each group:
- Data should come from a random sample, or treatments were randomly assigned.
- If sampling without replacement, check the 10% condition:
Between groups:
- The two samples must be independent of each other.
- No pairing, no matching.
If it’s a randomized experiment, you can discuss cause and effect later. If it’s only random sampling, you can generalize to the population but not claim causation.
2. Nearly Normal Condition
The sampling distribution of should be approximately normal.
That happens if:
- Both sample sizes are at least 30, or
- For smaller samples, both distributions show:
- No strong skewness
- No outliers
You must check this for each sample separately.
For small samples, the shape really matters. Compare the two dotplots below.
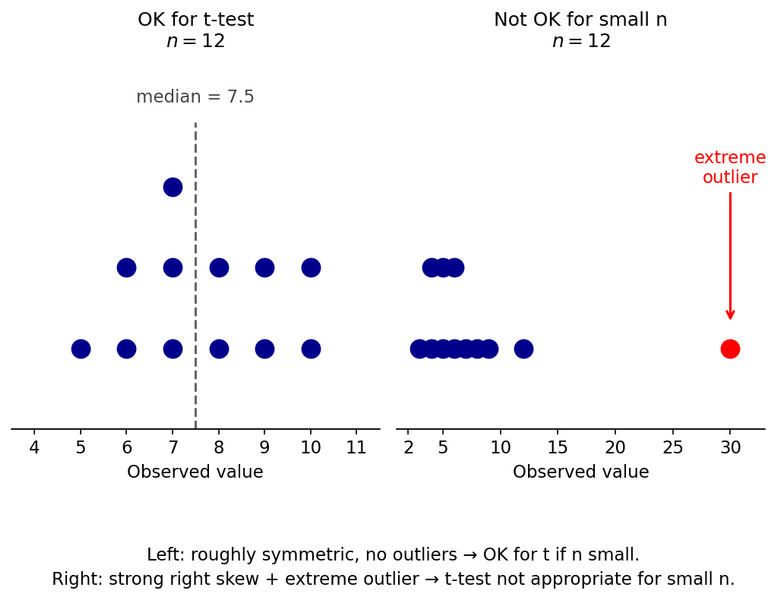
Small-sample distributions: acceptable vs. not acceptable for a t-test
On the left, the distribution is roughly symmetric with no outliers, so a t-test is reasonable even with . On the right, there is strong right skew and an extreme outlier. With a small sample size, that violates the Nearly Normal condition.
If one group is heavily skewed with an outlier and n is small, the t-test is not appropriate.
What You Should Be Able to Do on a Quiz
Given a scenario, you should be able to:
- Identify that the variable is quantitative.
- Recognize two independent groups.
- State the parameter in context.
- Write correct null and alternative hypotheses.
- Check Random, 10%, and Nearly Normal conditions clearly and in context.
On free-response, vague statements like “conditions are met” earn zero credit. You must tie each condition to the actual study described.
Key Takeaways
Null and Alternative Hypotheses for Two Means
H0: μ1 - μ2 = 0 or μ1 = μ2; Ha: μ1 - μ2 ≠ 0, < 0, or > 0.
Parameter Notation for Two Means
μ1 and μ2 represent the true population means for groups 1 and 2.
Independent Groups
The two samples come from separate groups, so observations in one sample do not affect the other.
Random Sampling or Random Assignment Condition
Data should come from simple random samples or a randomized experiment.
10% Condition for Two Samples
When sampling without replacement, check that n1 ≤ 10% of N1 and n2 ≤ 10% of N2.
Large Sample Condition
If either sample distribution is skewed, both sample sizes should be greater than 30.
Small Sample Shape Check
If a sample size is under 30, both samples should show no strong skewness or outliers.
Two-Sample T-Test for a Difference of Two Population Means
A significance test for comparing means of two independent groups with quantitative data.
Normal Condition for Two-Sample T-Tests
The distribution of x̄1 − x̄2 must be approximately normal for valid inference.
Notes
Null and Alternative Hypotheses for Two Means
H0: μ1 - μ2 = 0 or μ1 = μ2; Ha: μ1 - μ2 ≠ 0, < 0, or > 0.
Parameter Notation for Two Means
μ1 and μ2 represent the true population means for groups 1 and 2.
Independent Groups
The two samples come from separate groups, so observations in one sample do not affect the other.
Random Sampling or Random Assignment Condition
Data should come from simple random samples or a randomized experiment.
10% Condition for Two Samples
When sampling without replacement, check that n1 ≤ 10% of N1 and n2 ≤ 10% of N2.
Large Sample Condition
If either sample distribution is skewed, both sample sizes should be greater than 30.
Small Sample Shape Check
If a sample size is under 30, both samples should show no strong skewness or outliers.
Two-Sample T-Test for a Difference of Two Population Means
A significance test for comparing means of two independent groups with quantitative data.
Normal Condition for Two-Sample T-Tests
The distribution of x̄1 − x̄2 must be approximately normal for valid inference.
