Topic 5.8 Notes – Sampling Distributions for Differences in Sample Means
1. The Sampling Distribution of
Picture this: you randomly sample students from School A and School B, compute each sample’s mean test score, and subtract. If you repeated that process over and over, each time calculating
those values would form a sampling distribution.
Assume:
- Population 1: mean , standard deviation , sample size
- Population 2: mean , standard deviation , sample size
- Samples are random and independent
Mean and Standard Deviation
The sampling distribution has predictable parameters:
The average of all possible sample differences equals the true population difference. That’s why is an unbiased estimator of .
Important details:
- You add variances, not standard deviations.
- Larger sample sizes make the distribution less spread out.
- More variability in either population increases the spread.
Students often forget to square the standard deviations before dividing by sample size. That mistake costs easy points.
2. Shape of the Sampling Distribution
Now we care about when this distribution is normal (or approximately normal), because that’s what lets us calculate probabilities using z-scores.
If Both Populations Are Normal
If each population distribution is normal, then is exactly normal, no matter the sample sizes.
If Populations Are Not Normal
This is where the Central Limit Theorem kicks in.
If both sample sizes are at least 30:
- Each sample mean is approximately normal.
- The difference of two approximately normal distributions is also approximately normal.
So we can model as normal.
Here’s the idea visually. The left panel shows a heavily skewed population. As the sample size increases (middle and right panels), the sampling distribution of the mean becomes more bell-shaped.
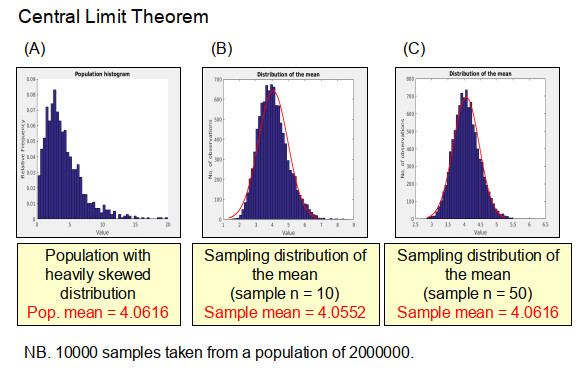
Central Limit Theorem illustration
On tests, you must justify normality for both groups. If one sample is large and the other is small from a skewed population, you cannot assume normality.
3. Sampling With and Without Replacement
The standard deviation formula technically assumes sampling with replacement.
If sampling without replacement:
- The true standard deviation is slightly smaller.
- If each sample size is less than 10% of its population, the difference is negligible.
This is the familiar 10% condition. On the AP exam, you state it to justify independence when sampling from a large population without replacement.
If the two samples come from completely separate populations, they’re automatically independent.
4. Using the Distribution to Find Probabilities
Suppose:
- , ,
- , ,
First find the parameters:
If we want :
Then use the normal table or calculator.
Interpretation in context matters. For example:
The mean of the sampling distribution is 4 points, meaning that in repeated sampling, the average difference in sample mean scores (School A minus School B) would be 4 points. The standard deviation is about 2.32 points, meaning the difference in sample means typically varies by about 2.32 points from sample to sample.
Units always stay attached.
5. Common Mistakes
- Subtracting standard deviations instead of adding variances.
- Checking the CLT condition for only one sample.
- Forgetting to mention independence or the 10% condition.
- Using this formula for paired data. Paired means use a different approach.
- Giving probability answers without context or units.
Key Takeaways
Sampling Distribution of x̄1 - x̄2
The distribution of possible differences between two sample means from repeated random samples.
Mean and Standard Deviation of x̄1 - x̄2
Mean is μ1 - μ2; standard deviation is √(σ1²/n1 + σ2²/n2) for independent samples.
Independent Random Samples
Samples chosen so one sample's outcomes do not affect the other's outcomes.
Sampling With Replacement vs. Without Replacement for x̄1 - x̄2
With replacement uses the usual formula; without replacement gives a slightly smaller standard deviation.
10% Condition for Differences in Sample Means
If each sample is under 10% of its population, ignoring reduced spread without replacement is acceptable.
Interpreting Parameters and Probabilities for x̄1 - x̄2
State center, spread, or probability in context, with correct units, for the two populations.
Normality Conditions for x̄1 - x̄2
It is normal if populations are normal, or approximately normal when both samples are at least 30.
Notes
Sampling Distribution of x̄1 - x̄2
The distribution of possible differences between two sample means from repeated random samples.
Mean and Standard Deviation of x̄1 - x̄2
Mean is μ1 - μ2; standard deviation is √(σ1²/n1 + σ2²/n2) for independent samples.
Independent Random Samples
Samples chosen so one sample's outcomes do not affect the other's outcomes.
Sampling With Replacement vs. Without Replacement for x̄1 - x̄2
With replacement uses the usual formula; without replacement gives a slightly smaller standard deviation.
10% Condition for Differences in Sample Means
If each sample is under 10% of its population, ignoring reduced spread without replacement is acceptable.
Interpreting Parameters and Probabilities for x̄1 - x̄2
State center, spread, or probability in context, with correct units, for the two populations.
Normality Conditions for x̄1 - x̄2
It is normal if populations are normal, or approximately normal when both samples are at least 30.
