Topic 2.3 Notes – Statistics for Two Categorical Variables
Two-way tables and what they show
A two-way table (also called a contingency table) organizes data for two categorical variables.
- One variable labels the rows.
- The other labels the columns.
- Each interior cell shows a joint frequency (count in both categories).
- The margins show row totals, column totals, and the grand total.
Here’s a simple example layout using school type and whether students play sports:
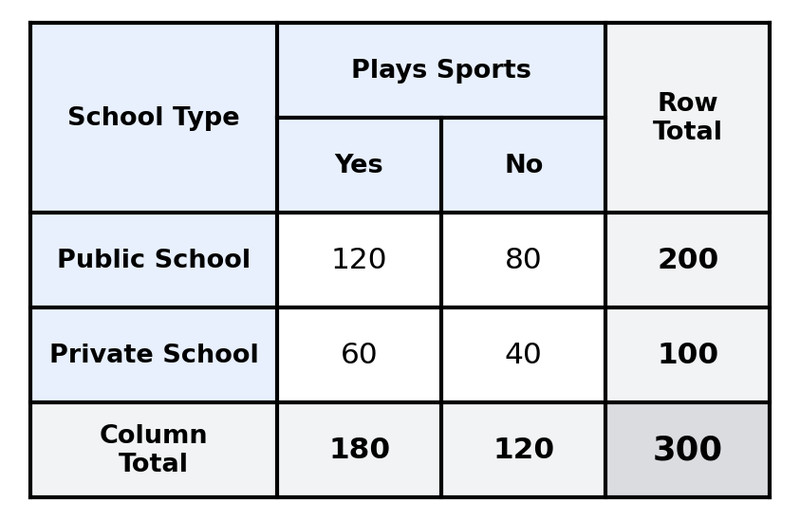
Two-way table: school type and sports participation
In this table, each interior value is a joint count. For example, 120 students are in public school and play sports. The totals along the right and bottom margins summarize each variable separately.
From a table like this, you can answer questions such as:
- How many students are in public school?
- How many private school students play sports?
- What percent of all students play sports?
Those last types of questions require relative frequencies.
Marginal relative frequencies
A marginal relative frequency uses a row or column total divided by the grand total.
It describes the overall distribution of one variable by itself.
Example using the table idea: If 180 out of 300 total students play sports, then
Interpretation (in context): “Overall, 60% of the students in the sample play a school sport.”
Notice we didn’t separate by school type. That’s what makes it marginal. It ignores the second variable.
Students often mix this up with conditional. Quick memory trick: marginal lives in the margins of the table.
Conditional relative frequencies
A conditional relative frequency looks at a proportion within one row or one column.
Now the denominator is not the grand total.
Suppose 120 of 200 public school students play sports:
Interpretation: “Among public school students, 60% play a school sport.”
That phrase “among public school students” tells you it’s conditional. You are conditioning on school type.
If instead you calculated
for private school students, you’d say: “Among private school students, 60% play a school sport.”
Now you can compare.
Comparing distributions and deciding association
This is the heart of the topic.
You are usually comparing the distribution of a response variable given different categories of an explanatory variable.
In practice:
- Decide which variable explains and which responds.
- Calculate the conditional relative frequencies of the response variable for each group.
- Compare those percentages across groups.
You might organize your comparison like this:
| Plays Sports | Public School | Private School |
|---|---|---|
| Yes | 60% | 60% |
| No | 40% | 40% |
If the conditional distributions are similar, the variables are likely independent (no association).
If they are different, the variables are associated.
Another way to think about it:
- If the conditional relative frequencies are different from each other, or noticeably different from the marginal distribution, that suggests an association.
How to write the conclusion
Associated: “There is an association between school type and sports participation because the conditional distribution of sports participation differs between public and private school students.”
Not associated: “There is no evidence of an association between school type and sports participation because the conditional distributions are similar across the two school types.”
On quizzes and the AP exam, you must:
- Use the word association or independent correctly.
- Reference conditional relative frequencies.
- State everything in context.
Common mistakes
- Dividing by the grand total when the question is conditional.
- Comparing raw counts instead of percentages.
- Forgetting to say “among ___” when interpreting a conditional.
- Claiming one variable causes the other. A two-way table alone only shows association.
Key Takeaways
Marginal Relative Frequency
A row or column total divided by the grand total in a two-way table.
Conditional Relative Frequency
A cell count divided by its row or column total, given one category.
Association vs. Independence in a Two-Way Table
Variables are associated when conditional relative frequencies differ and independent when they are the same.
Notes
Marginal Relative Frequency
A row or column total divided by the grand total in a two-way table.
Conditional Relative Frequency
A cell count divided by its row or column total, given one category.
Association vs. Independence in a Two-Way Table
Variables are associated when conditional relative frequencies differ and independent when they are the same.
