Topic 1.8 Notes – Graphical Representations of Summary Statistics
The Five-Number Summary
A five-number summary gives a quick snapshot of a quantitative distribution using:
- Minimum - smallest value
- Q1 (first quartile) - median of the lower half
- Median (Q2) - middle value
- Q3 (third quartile) - median of the upper half
- Maximum - largest value
Together, these describe center and spread, and hint at shape.
How to Find It
Imagine you have 9 values representing the number of texts sent in a day:
2, 5, 7, 9, 10, 12, 15, 18, 21
- They’re already ordered.
- Median is the 5th value → 10.
- Since (odd), leave out the median when splitting.
- Lower half: 2, 5, 7, 9 → Q1 is
- Upper half: 12, 15, 18, 21 → Q3 is
Five-number summary:
- Min = 2
- Q1 = 6
- Median = 10
- Q3 = 16.5
- Max = 21
Two related measures:
- Range = max − min
- IQR (Interquartile Range)
Here, IQR = .
The middle 50% of days had between 6 and 16.5 texts.
Notice how this ignores extreme values. That resistance to outliers is important when we move to boxplots.
Boxplots
A boxplot is the visual version of the five-number summary.
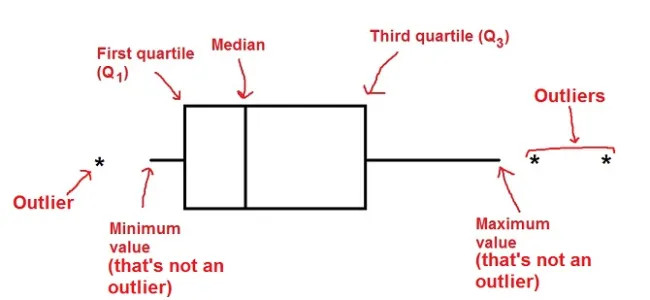
Box-and-whisker plot with outliers
Here’s how to read it:
- The box goes from Q1 to Q3 → this is the middle 50%.
- The line inside is the median.
- The whiskers extend to the smallest and largest non-outlier values.
- Outliers are plotted as separate points.
The 1.5 × IQR Rule
Outliers are determined using “fences”:
Any value outside those fences is an outlier.
Important detail students miss: the fences are not drawn. The whiskers stop at the most extreme value that is not an outlier.
Boxplots are especially helpful when comparing groups, like side-by-side plots of test scores for two classes.
Shape and the Mean-Median Relationship
Even though boxplots don’t show the mean, you can often predict its location from shape.
Symmetric Distribution
- Median near the center of the box.
- Whiskers about equal length.
- Mean ≈ median.
Skewed Right
- Right whisker longer.
- Median closer to Q1.
- Tail stretches toward higher values.
- Mean > median.
Skewed Left
- Left whisker longer.
- Median closer to Q3.
- Tail stretches toward lower values.
- Mean < median.
When describing skew, always name the variable:
“The distribution of daily text counts is skewed right, with a longer tail toward higher numbers of texts.”
Saying “the box is skewed” won’t earn full credit. The distribution is skewed.
Using Graphs to Justify Claims
This is where points are won or lost.
When comparing two boxplots, you should comment on:
- Center
Compare medians.
“Class A had a higher median exam score (82) than Class B (76).” - Spread
Compare IQRs for typical variability.
Larger IQR means more variation in the middle 50%. - Shape
Mention skew and how you can tell (whisker length, median position). - Outliers
State whether any are present.
Every claim must be in context. If the data are commute times, say “commute times,” not just “values.”
One subtle AP detail: if a distribution is clearly skewed, use the median and IQR to compare groups, not the mean and standard deviation.
Key Takeaways
Five-Number Summary
Minimum, Q1, median, Q3, and maximum values that summarize a quantitative dataset.
Quartiles
Values that divide ordered data into four equal parts: Q1, median, and Q3.
Interquartile Range (IQR)
Q3 minus Q1; the spread of the middle 50% of the data.
Fences and the 1.5 IQR Rule
Lower fence is Q1 minus 1.5 IQR; upper fence is Q3 plus 1.5 IQR.
Outlier on a Boxplot
A value below the lower fence or above the upper fence, plotted separately.
Describing Summary Statistics in Context
Use center, spread, shape, and outliers from graphs to support claims about real data.
Boxplot
Graph of the five-number summary with a box, median line, whiskers, and separate outliers.
Distribution Shape and Mean-Median Relationship
Shape can be inferred from boxplots, and mean-median position helps identify symmetry or skew.
Notes
Five-Number Summary
Minimum, Q1, median, Q3, and maximum values that summarize a quantitative dataset.
Quartiles
Values that divide ordered data into four equal parts: Q1, median, and Q3.
Interquartile Range (IQR)
Q3 minus Q1; the spread of the middle 50% of the data.
Fences and the 1.5 IQR Rule
Lower fence is Q1 minus 1.5 IQR; upper fence is Q3 plus 1.5 IQR.
Outlier on a Boxplot
A value below the lower fence or above the upper fence, plotted separately.
Describing Summary Statistics in Context
Use center, spread, shape, and outliers from graphs to support claims about real data.
Boxplot
Graph of the five-number summary with a box, median line, whiskers, and separate outliers.
Distribution Shape and Mean-Median Relationship
Shape can be inferred from boxplots, and mean-median position helps identify symmetry or skew.
