Topic 9.5 Notes – Carrying Out a Test for the Slope of a Regression Model
1. The Slope Test in Linear Regression
In simple linear regression, we model the relationship between an explanatory variable and a response variable :
- = true population slope
- = sample slope from the least-squares regression line (estimate of )
A test for the slope asks whether the true slope differs from some value (almost always 0).
Most common hypotheses:
- H₀:
(No linear relationship in the population.) - Hₐ:
- (two-sided)
If , changes in do not predict changes in the mean of .
When conditions are met and is true, the slope statistic follows a t-distribution. That’s the key idea of this whole topic.
2. Conditions and the Null Distribution of the Slope
Before doing any calculations, regression inference requires the LINE conditions:
- Linear: The relationship looks linear (check scatterplot and residual plot).
- Independent: Observations are independent (random sample or random assignment; 10% condition if sampling).
- Normal: For each value of , the response is normally distributed (or sample is large).
- Equal variance: Residuals show constant spread (no funnel shape).
Here’s what violations look like in a residual plot. In the top two graphs the residuals stay centered on 0, but their spread grows (top) or shrinks (middle) as increases. That fan shape signals a problem with the equal variance condition. The bottom graph shows random scatter with roughly constant spread, which is what you want to see.
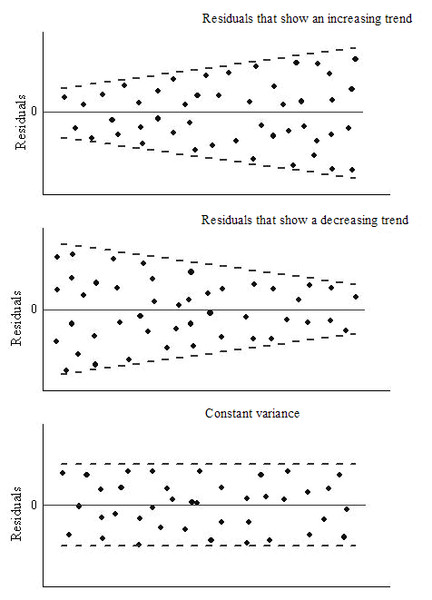
Residual plots: patterns vs. constant variance
If these conditions are satisfied and is true, then the standardized slope
follows a t-distribution with df = n − 2.
Important pieces:
- = sample slope (estimate of )
- Typical test: , so (same as )
- = standard error of the slope
- df = n − 2
Why ? Because we estimated two parameters from the data: the intercept and the slope.
3. Calculating the Test Statistic and p-Value
Step 1: State hypotheses in context
Example wording:
Let be the true slope relating hours of sleep to reaction time for high school students.
Then state and .
You must define in words. Skipping that costs points.
Step 2: Compute the test statistic
This tells you how many standard errors your sample slope is from the hypothesized slope.
If , , and testing :
That means the observed slope is 3 standard errors above 0.
Step 3: Find the p-value
Use:
- t-distribution
- df =
- One- or two-sided based on
The p-value is:
The probability of getting a slope statistic at least as extreme as the one observed, assuming (for example ) is true.
Calculator note: Most regression output already gives you the t-value and p-value. Just be sure the df matches .
4. Making and Justifying the Conclusion
Compare the p-value to :
- If , reject .
- If , fail to reject .
Your conclusion must:
- State the decision.
- Answer the research question.
- Refer to a linear relationship.
- Stay in context.
Example (rejecting):
Since the p-value is less than 0.05, we reject . There is convincing evidence of a linear relationship between hours of sleep and mean reaction time for high school students.
Notice it says linear and names both variables.
The test result is your statistical reasoning supporting the research claim.
5. Interpretation and Common Mistakes
Correct p-value interpretation
Always include the assumption:
Assuming , the probability of obtaining a sample slope this extreme (or more extreme) is ___.
Students often forget the “assuming is true” part. That assumption is the entire logic of significance testing.
Common AP mistakes
- Using df = n − 1 instead of .
- Saying “there is a relationship” instead of “there is a linear relationship.”
- Claiming causation with observational data.
- Forgetting to define .
- Saying the p-value is the probability that is true.
That last one shows up constantly on multiple choice.
Key Takeaways
Test Statistic for the Slope of a Regression Model
Compute t = (b - β0) / SEb to compare the sample slope to the hypothesized slope.
Null Distribution for the Slope
Assuming conditions hold and H0 is true, the standardized slope statistic follows a t-distribution.
Degrees of Freedom for a Slope Test
For simple linear regression, use df = n - 2 for the t-distribution of the slope statistic.
Decision Rule Using P-Value and Significance Level
Reject H0 if p-value ≤ α; otherwise, fail to reject H0.
Conclusion About the Population Slope
State whether there is convincing evidence that the true population slope differs from the null value.
Null and Alternative Hypotheses for a Slope Test
State H0: β = β0 and Ha: β < β0, β > β0, or β ≠ β0.
One-Tailed vs. Two-Tailed Slope Tests
Use β < β0 or β > β0 for directional claims, and β ≠ β0 for any difference.
P-Value for a Slope Test
It is the probability, assuming β equals the null value, of results this extreme.
Degrees of Freedom Exception for Slope Test
When testing a single regression parameter, the slope test uses n minus 1 degrees of freedom.
Notes
Test Statistic for the Slope of a Regression Model
Compute t = (b - β0) / SEb to compare the sample slope to the hypothesized slope.
Null Distribution for the Slope
Assuming conditions hold and H0 is true, the standardized slope statistic follows a t-distribution.
Degrees of Freedom for a Slope Test
For simple linear regression, use df = n - 2 for the t-distribution of the slope statistic.
Decision Rule Using P-Value and Significance Level
Reject H0 if p-value ≤ α; otherwise, fail to reject H0.
Conclusion About the Population Slope
State whether there is convincing evidence that the true population slope differs from the null value.
Null and Alternative Hypotheses for a Slope Test
State H0: β = β0 and Ha: β < β0, β > β0, or β ≠ β0.
One-Tailed vs. Two-Tailed Slope Tests
Use β < β0 or β > β0 for directional claims, and β ≠ β0 for any difference.
P-Value for a Slope Test
It is the probability, assuming β equals the null value, of results this extreme.
Degrees of Freedom Exception for Slope Test
When testing a single regression parameter, the slope test uses n minus 1 degrees of freedom.
