Topic 4.8 Notes – Mean and Standard Deviation of Random Variables
1. Parameters of a Discrete Random Variable
A parameter is a single, fixed numerical value that describes a population or the distribution of a random variable.
When you’re given a discrete random variable (usually with a probability table), the two key parameters are:
- Mean → center
- Standard deviation → spread
These describe the distribution of X itself, not a sample. Even though outcomes vary, the parameters are fixed numbers.
Important reminders:
- Both and are in the same units as X.
- They describe long-run behavior if the chance process is repeated many times.
- They are not statistics like or . Those come from samples.
2. The Mean or Expected Value
The mean of a discrete random variable is also called the expected value. Think of it as a weighted average, where probabilities act as weights.
Formula
You multiply each possible value by its probability and add.
Here’s what that looks like with an actual probability distribution:

Expected value from a discrete probability distribution
What it means
- It’s the long-run average outcome.
- It may be a decimal even if X only takes whole numbers.
- It does not represent a probability.
Correct interpretation example:
In the long run, the average number of defective items per shipment is about 1.7 items.
Notice:
- It names the variable.
- It includes units.
- It uses long-run language.
Common mistakes I see on quizzes:
- Just averaging the x-values without using probabilities.
- Rounding to a whole number because “you can’t have 1.7 items.”
- Saying “There is a 1.7 probability…” which makes no sense.
3. Variance and Standard Deviation
Mean tells you center. Now we measure how spread out the distribution is.
Variance
This is the average squared distance from the mean.
Standard Deviation
This puts the measure back in the original units, which is why we interpret standard deviation, not variance.
Conceptually, you:
- Subtract the mean from each value.
- Square it.
- Multiply by its probability.
- Add.
- Take the square root.
Here’s what different spreads look like when the mean stays the same:
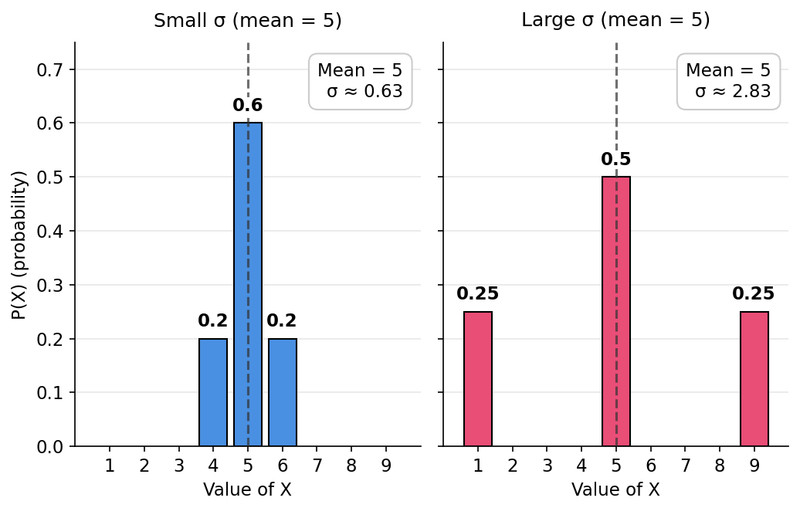
Two discrete distributions with the same mean but different standard deviations
Both distributions have mean 5. The one on the left is tightly clustered around 5, so its standard deviation is small. The one on the right puts more probability far from 5, so its standard deviation is larger.
Interpretation
Correct format:
The number of defective items per shipment typically varies by about 0.9 items from the mean of 1.7 items.
Key words:
- “typically”
- “from the mean”
- includes units
Students often lose points by writing:
- “The standard deviation is 0.9.” (No context.)
- Or forgetting to mention the mean.
4. Interpreting Parameters in Context
On tests and the AP exam, calculations alone don’t earn full credit. Your interpretation must:
- Refer to the random variable
- Include the units
- Use long-run or typical language
Mean → long-run average
Standard deviation → typical distance from the mean
If a question says “Describe the distribution,” they want both ideas: center and spread, stated in context.
5. Big Picture Connections
A probability distribution models population variation. The parameters and summarize that variation.
Think of it this way:
- A histogram of data → summarized by and .
- A probability distribution → summarized by and .
Same ideas. Different setting.
Whenever you see a probability table, your brain should immediately think:
- Weighted average for the mean.
- Typical distance from the mean for spread.
Key Takeaways
Parameter
A fixed numerical value describing a population characteristic or a random variable's distribution.
Variance of a Discrete Random Variable
The probability-weighted average of squared deviations from the mean.
Interpreting Mean and Standard Deviation in Context
State the average and typical spread using the variable's units and the population context.
Mean / Expected Value of a Discrete Random Variable
The long-run average, found by summing each value multiplied by its probability.
Standard Deviation of a Discrete Random Variable
The square root of the probability-weighted squared deviations from the mean.
Notes
Parameter
A fixed numerical value describing a population characteristic or a random variable's distribution.
Variance of a Discrete Random Variable
The probability-weighted average of squared deviations from the mean.
Interpreting Mean and Standard Deviation in Context
State the average and typical spread using the variable's units and the population context.
Mean / Expected Value of a Discrete Random Variable
The long-run average, found by summing each value multiplied by its probability.
Standard Deviation of a Discrete Random Variable
The square root of the probability-weighted squared deviations from the mean.
