Topic 5.6 Notes – Sampling Distributions for Differences in Sample Proportions
What the sampling distribution of is
Imagine two independent populations:
- Population 1 has true proportion
- Population 2 has true proportion
We take:
- A random sample of size → compute
- A random sample of size → compute
Now we look at the statistic:
If we repeated this whole process many times, those differences would form a sampling distribution.
Mean (Center)
The estimator is unbiased. On average, the sample difference equals the true population difference.
If the true difference is 0.08, the sampling distribution is centered at 0.08.
Standard Deviation (Spread)
Two key ideas are built into this formula:
- Each proportion has variability
- Variances add for independent samples
Students sometimes forget that you add the two variance pieces before taking the square root.
What affects the spread?
- Larger or → smaller spread
- Proportions near 0.5 → larger variability
- Proportions near 0 or 1 → smaller variability
If sampling without replacement, the true standard deviation is slightly smaller than the formula gives. As long as each sample is less than 10% of its population, the difference is negligible and we use the formula above.
When the distribution is approximately normal
The sampling distribution of is approximately Normal when sample sizes are large enough.
1. Independent random samples
- Each sample is random (SRS or random assignment)
- The two samples are independent of each other
2. 10% condition (if sampling without replacement)
This supports the standard deviation formula.
3. Large Counts condition
All four must be true:
You are checking for enough expected successes and failures in both samples.
When these conditions are met, the sampling distribution looks like this:
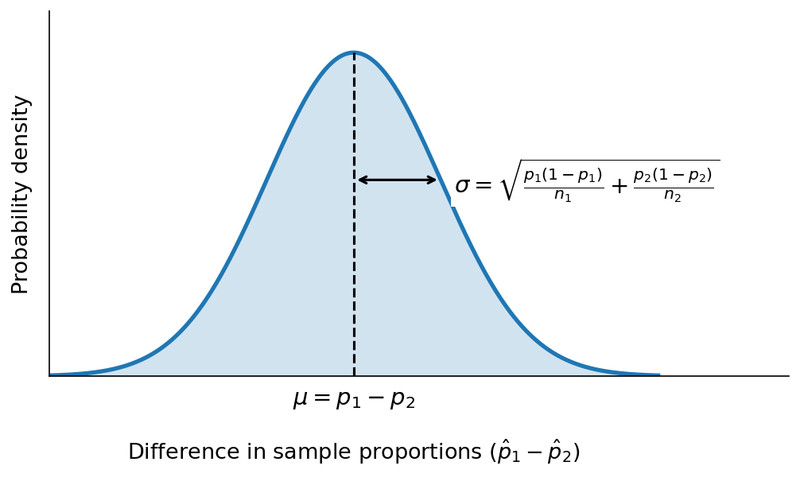
Normal model for
The curve is centered at and has standard deviation , the formula you saw earlier.
Important detail: for proportions, we use the Large Counts condition, not the CLT for means. That distinction shows up in multiple-choice questions.
Shape, Center, and Spread Summary
When conditions are met:
- Shape: Approximately Normal
- Center:
- Spread:
If an FRQ asks you to “describe the sampling distribution,” you must state all three and justify normality using the Large Counts condition.
Interpreting parameters and probabilities in context
This is where points are often lost. Everything must reference:
- Random sampling
- Repeated samples
- The specific populations
Interpreting the mean
“The mean of the sampling distribution is , meaning that in repeated random samples, the average difference in sample proportions would equal the true difference in population proportions of [state the actual groups].”
Parameters are fixed. The sample statistic varies.
Interpreting the standard deviation
This describes typical sampling variability in the difference from sample to sample. It does not describe individual variability.
Interpreting a probability
If you compute something like
You would say:
“This is the probability that the difference in sample proportions would exceed 0.05 in repeated random samples from these two populations, assuming the stated population proportions are correct.”
You are describing long-run behavior of the statistic.
Key Takeaways
Sampling Distribution of p̂1 - p̂2
The distribution of possible differences between two sample proportions from repeated independent samples.
Mean and Standard Deviation of p̂1 - p̂2
Mean is p1 - p2; standard deviation is √[p1(1-p1)/n1 + p2(1-p2)/n2].
Independent Populations
Two groups whose samples are selected so one sample's outcomes do not affect the other's.
With Replacement vs. Without Replacement for p̂1 - p̂2
With replacement uses the standard formula; without replacement gives a slightly smaller standard deviation.
10% Condition for Differences in Proportions
If each sample is less than 10% of its population, ignoring replacement has negligible effect.
Interpreting Parameters in Context for p̂1 - p̂2
Describe center and spread as differences in population proportions using the problem's groups and units.
Large Counts Condition and Approximate Normality for p̂1 - p̂2
The distribution is approximately normal when all four expected counts are at least 10.
Notes
Sampling Distribution of p̂1 - p̂2
The distribution of possible differences between two sample proportions from repeated independent samples.
Mean and Standard Deviation of p̂1 - p̂2
Mean is p1 - p2; standard deviation is √[p1(1-p1)/n1 + p2(1-p2)/n2].
Independent Populations
Two groups whose samples are selected so one sample's outcomes do not affect the other's.
With Replacement vs. Without Replacement for p̂1 - p̂2
With replacement uses the standard formula; without replacement gives a slightly smaller standard deviation.
10% Condition for Differences in Proportions
If each sample is less than 10% of its population, ignoring replacement has negligible effect.
Interpreting Parameters in Context for p̂1 - p̂2
Describe center and spread as differences in population proportions using the problem's groups and units.
Large Counts Condition and Approximate Normality for p̂1 - p̂2
The distribution is approximately normal when all four expected counts are at least 10.
