Topic 2.4 Notes – Representing the Relationship Between Two Quantitative Variables
1. Bivariate Quantitative Data and Scatterplots
A bivariate quantitative data set has:
- Two quantitative variables
- Measured on the same individuals
- Recorded as ordered pairs
Example: For each student, you record
- Hours studied (x)
- Test score (y)
Each student gives one point on the graph.
A scatterplot displays this data:
- Horizontal axis → explanatory variable (x)
- Vertical axis → response variable (y)
- Each dot → one individual
Here’s a simple example of a scatterplot showing hours studied and test score.
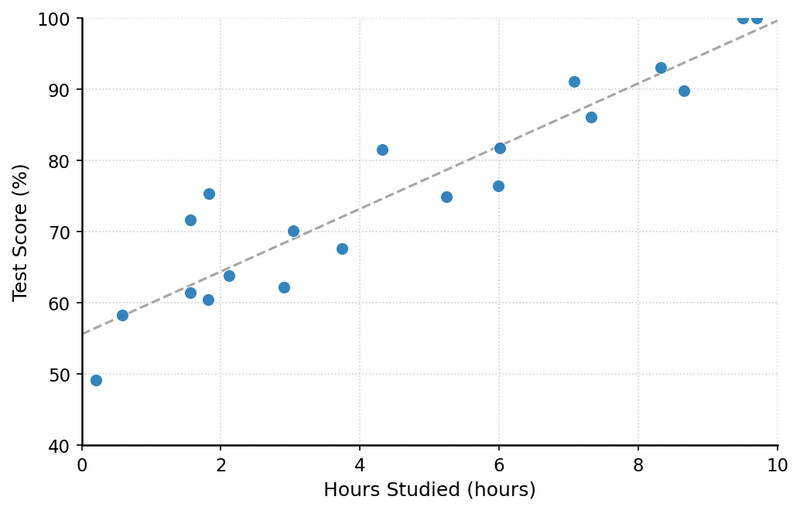
Scatterplot of hours studied vs. test score
When you look at this, you’re seeing association. You are not proving cause-and-effect. Even if the pattern looks strong, a scatterplot alone cannot establish causation.
2. Explanatory and Response Variables
Before you describe anything, you need to decide which variable goes on which axis.
- Explanatory variable (independent)
- Placed on the x-axis
- Used to explain or predict
- Response variable (dependent)
- Placed on the y-axis
- The outcome being measured
To decide, ask: Which one makes sense as the predictor?
- In an experiment, the explanatory variable is usually the one being manipulated.
- In an observational study, choose the variable that logically could influence the other.
Common mistake on quizzes: describing the graph backward.
Say, “As hours studied increases, test score tends to increase.”
Don’t flip it unless it truly makes sense.
3. How to Describe a Scatterplot
When AP graders read your answer, they look for four things every time:
Form
The overall shape of the relationship.
- Linear → points follow a straight-line pattern
- Nonlinear → curved or changing pattern
- No clear form → say there’s no apparent association
You’re describing the shape, not calculating anything yet.
Direction
Look from left to right.
- Positive association → as x increases, y tends to increase
- Negative association → as x increases, y tends to decrease
Direction only exists if there’s a noticeable pattern.
Strength
How tightly the points follow the form.
- Strong → points tightly clustered around pattern
- Moderate → noticeable pattern with scatter
- Weak → lots of scatter, hard to see pattern
Strength is about how close the points are to the pattern, not how steep the graph is. A steep line can still be weak.
Unusual Features
These matter more than students expect.
- Clusters → distinct groupings of points
- Outliers → points far from the overall pattern
- Points with large vertical deviations (large discrepancies between actual and predicted y-values)
Here’s a scatterplot with a positive linear pattern, a small cluster in the lower left, and one clear outlier far above the rest.
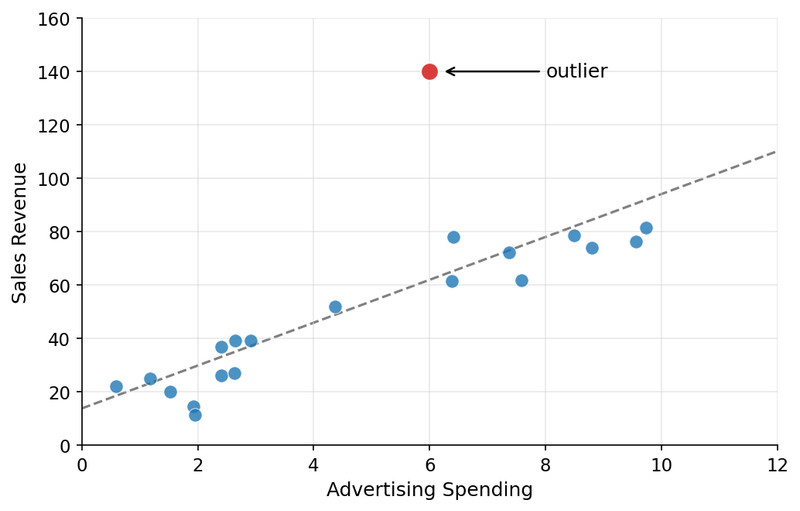
Scatterplot with cluster and outlier
Unusual points can strongly affect later calculations like correlation and regression.
4. Outliers, High Leverage, and Influential Points
These are related but different ideas.
Outlier
- Has a large residual (far from the regression line)
- The predicted and actual y-values are very different
High leverage point
- Unusual in the x-direction
- Has an extreme x-value compared to others
Influential point
- Removing it would noticeably change the regression line
- Often high leverage, but not always
A high leverage point that fits the pattern well might not be influential. An outlier in the middle of the x-values might not change the line much.
AP questions sometimes show two regression lines, one with and one without a point. If the line changes a lot, that point is influential.
5. Writing a Complete AP-Style Description
A full-credit description includes:
- Form
- Direction
- Strength
- Unusual features
- All written in context
Example structure:
There is a moderate positive linear association between hours studied and test score for the students in this sample. As hours studied increases, test scores tend to increase. There is one possible outlier with a much higher test score than expected.
Avoid:
- Claiming causation
- Leaving out one of the four elements
- Speaking generically without naming variables
On FRQs, missing just one element often costs a point.
Key Takeaways
Bivariate Quantitative Data
Data consisting of paired numerical measurements for two variables on each individual.
Scatterplot
A graph of paired quantitative data with one variable on each axis.
Axes in a Scatterplot
The explanatory variable goes on the horizontal axis and the response variable on the vertical axis.
Describing a Scatterplot
Describe association by form, direction, strength, and unusual features, in context.
Form of a Scatterplot
The overall shape of the association, usually linear or nonlinear.
Direction of Association
The overall trend of the points, described as positive or negative.
Strength of Association
How closely the points follow the overall pattern, such as strong, moderate, or weak.
Unusual Features in a Scatterplot
Patterns that stand out, especially clusters or points far from the overall pattern.
Cluster
A group of nearby points that may suggest a subgroup within the data.
Outlier in a Scatterplot
A point with a response value far from what the overall pattern would predict.
Explanatory Variable and Response Variable
The x-variable explains or predicts, and the y-variable records the resulting outcome.
Positive and Negative Association
An increasing pattern is positive, while a decreasing pattern is negative.
Linear and Nonlinear Association
A straight-line pattern is linear, while a curved pattern is nonlinear.
Notes
Bivariate Quantitative Data
Data consisting of paired numerical measurements for two variables on each individual.
Scatterplot
A graph of paired quantitative data with one variable on each axis.
Axes in a Scatterplot
The explanatory variable goes on the horizontal axis and the response variable on the vertical axis.
Describing a Scatterplot
Describe association by form, direction, strength, and unusual features, in context.
Form of a Scatterplot
The overall shape of the association, usually linear or nonlinear.
Direction of Association
The overall trend of the points, described as positive or negative.
Strength of Association
How closely the points follow the overall pattern, such as strong, moderate, or weak.
Unusual Features in a Scatterplot
Patterns that stand out, especially clusters or points far from the overall pattern.
Cluster
A group of nearby points that may suggest a subgroup within the data.
Outlier in a Scatterplot
A point with a response value far from what the overall pattern would predict.
Explanatory Variable and Response Variable
The x-variable explains or predicts, and the y-variable records the resulting outcome.
Positive and Negative Association
An increasing pattern is positive, while a decreasing pattern is negative.
Linear and Nonlinear Association
A straight-line pattern is linear, while a curved pattern is nonlinear.
