Topic 2.9 Notes – Analyzing Departures from Linearity
Influential Points in Regression
The least-squares regression line (LSRL) is built to minimize squared residuals. Because of that, certain points can pull the line around more than others.
An influential point is any observation that, if removed, would noticeably change:
- the slope
- the y-intercept
- the correlation (and therefore )
There are two main types you need to recognize.
Outliers in Regression
An outlier is a point that does not follow the overall linear trend and has a large residual (big vertical distance from the LSRL).
You spot it on a residual plot as a point far above or below 0.
Effects:
- Often reduces
- Increases scatter in residuals
- May shift the y-intercept
- Sometimes changes slope, but not always
Important: A point can be an outlier without being influential if removing it barely changes the line.
High-Leverage Points
A high-leverage point has an unusually large or small x-value compared to the rest.
You see these on the scatterplot, far left or right.
Effects:
- Pulls the regression line toward itself
- Often changes the slope
- Can increase or decrease
Not all high-leverage points are bad. If they follow the pattern, they can actually strengthen the model.
How They Relate
A point can be:
- Outlier only
- High leverage only
- Both
The most dangerous situation is high leverage + large residual. That combination is very likely to be influential.
Look at the scatterplot below. The cluster of points follows a clear positive linear trend, but there is one point far to the right and well above the pattern. That single point has high leverage because its x-value is extreme, and it has a large residual because it sits far above the original line.
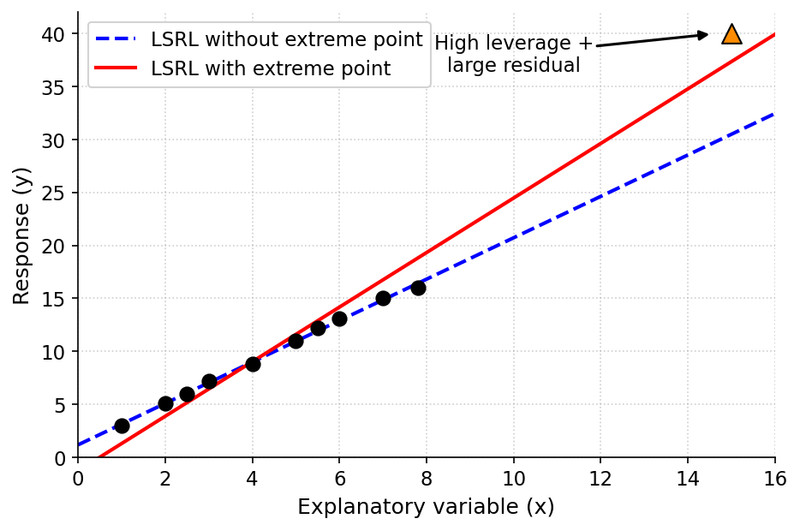
High leverage point with large residual changing the LSRL
Notice how the red regression line that includes the extreme point is much steeper than the dashed line that ignores it. That big change in slope is exactly what makes the point influential.
If removing a point causes a big change in slope or correlation, you call it influential.
When you write about it, be specific:
“This point is a high-leverage point because its x-value is much larger than the others. Removing it would decrease the slope substantially, so it is influential.”
Vague answers like “it changes the graph” don’t earn credit.
When the Relationship Is Not Linear
Sometimes the scatterplot curves and the residual plot shows a pattern.
If the residual plot has a curved shape, the linear model is not appropriate.
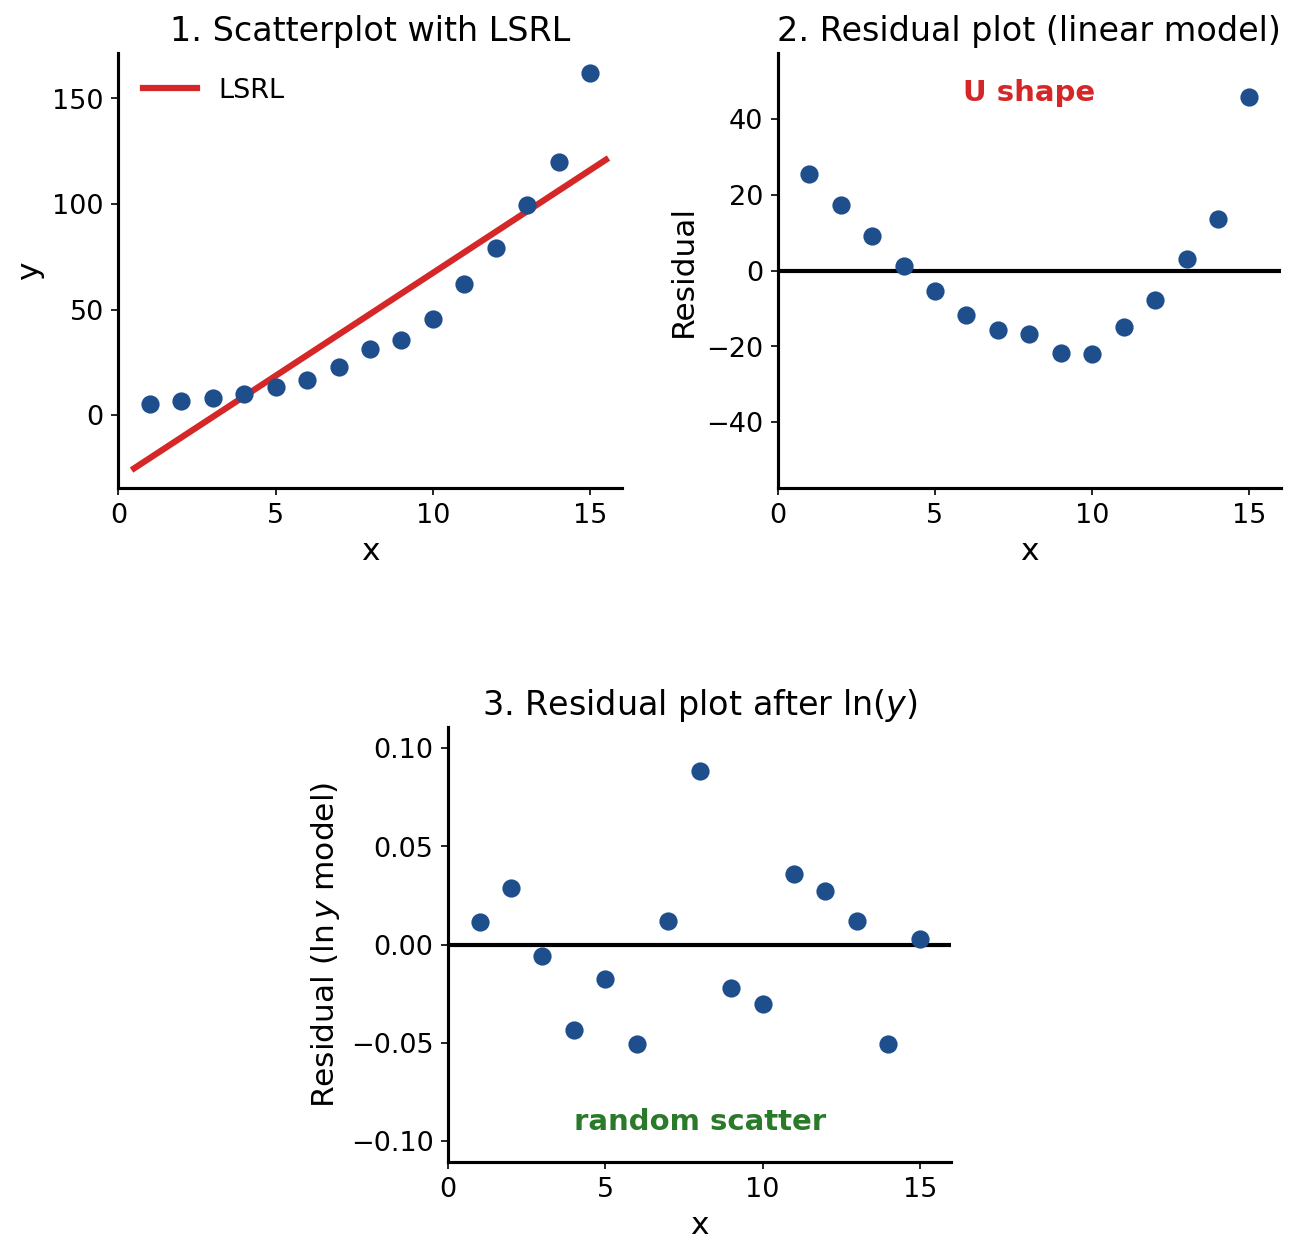
Exponential data: the straight line misses the curve, the residual plot shows a U shape, and after taking the residuals look random
In panel 1, the LSRL underpredicts at both ends and overpredicts in the middle. That is why the residuals in panel 2 are positive, then negative, then positive again: a clear U shape, so a linear model is not appropriate. Panel 3 shows the residuals after taking : no pattern, just random scatter around 0.
A good residual plot should look like random scatter around 0. If you see structure, your model is missing something.
This is where transformations come in.
A transformation applies a function (often natural log) to x and/or y to create a new, more linear dataset.
Evidence a transformation helped:
- Residual plot becomes more random
- moves closer to 1
You’re not chasing a bigger just for fun. You’re trying to justify a better predictive model.
Exponential and Power Models
These are the most common nonlinear models on AP Stats, though other transformations (like squaring x) can also appear.
Exponential Models
Form:
Used for growth or decay.
To linearize, take the natural log of y:
Now you run linear regression of on .
From the regression output:
- Intercept =
- Slope =
Convert back:
For prediction:
- Plug in x.
- Compute predicted .
- Exponentiate to return to original units.
Students lose easy points by forgetting step 3.
Power Models
Form:
Linearize by taking logs of both variables:
Now run regression of on .
From output:
- Intercept =
- Slope =
Convert back:
Key difference to remember:
- Exponential → log y only
- Power → log both x and y
Key Takeaways
Influential Point
A data point whose removal substantially changes the regression line or correlation.
Outlier in Regression
A point far from the overall pattern vertically, with a large residual.
High-Leverage Point
A point with an x-value much farther from the others than most observations.
Outliers vs. High-Leverage Points
Outliers are unusual in y with large residuals; high-leverage points are unusual in x.
Transformed Data Set
A new data set created by applying a function to x, y, or both.
Linearizing a Relationship
Applying transformations so a curved pattern becomes approximately linear for regression.
Exponential Model
A nonlinear model of the form y-hat = ab^x, with constant multiplicative change.
Power Model
A nonlinear model of the form y-hat = ax^b, relating variables by powers.
Exponential Model Transformation
Take ln(y) so the model becomes linear: ln(y-hat) = ln(a) + x ln(b).
Power Model Transformation
Take ln(x) and ln(y) so the model becomes linear: ln(y-hat) = ln(a) + b ln(x).
Residual Plot Evidence After Transformation
A better model has residuals that look more random and less curved after transformation.
Using r-Squared to Compare Transformed Models
A transformed model is stronger when its r-squared moves closer to 1.
Predicting with a Transformed Regression Model
Use the transformed line, then undo the transformation to predict on the original scale.
Influential Points and Their Types
Outliers and high-leverage points are often influential because they can strongly change regression results.
Notes
Influential Point
A data point whose removal substantially changes the regression line or correlation.
Outlier in Regression
A point far from the overall pattern vertically, with a large residual.
High-Leverage Point
A point with an x-value much farther from the others than most observations.
Outliers vs. High-Leverage Points
Outliers are unusual in y with large residuals; high-leverage points are unusual in x.
Transformed Data Set
A new data set created by applying a function to x, y, or both.
Linearizing a Relationship
Applying transformations so a curved pattern becomes approximately linear for regression.
Exponential Model
A nonlinear model of the form y-hat = ab^x, with constant multiplicative change.
Power Model
A nonlinear model of the form y-hat = ax^b, relating variables by powers.
Exponential Model Transformation
Take ln(y) so the model becomes linear: ln(y-hat) = ln(a) + x ln(b).
Power Model Transformation
Take ln(x) and ln(y) so the model becomes linear: ln(y-hat) = ln(a) + b ln(x).
Residual Plot Evidence After Transformation
A better model has residuals that look more random and less curved after transformation.
Using r-Squared to Compare Transformed Models
A transformed model is stronger when its r-squared moves closer to 1.
Predicting with a Transformed Regression Model
Use the transformed line, then undo the transformation to predict on the original scale.
Influential Points and Their Types
Outliers and high-leverage points are often influential because they can strongly change regression results.
