Topic 7.4 Notes – Setting Up a Test for a Population Mean
What a One-Sample t-Test Is
A one-sample t-test is used to test a claim about a population mean when the population standard deviation is unknown. That’s almost always the case in real data, so we use the t-distribution.
You’re in one-sample t-test territory when:
- The variable is quantitative (heights, times, scores, weights, etc.)
- You have one sample
- You are comparing the sample mean to a claimed value
The idea: if the claim about were true, how likely would it be to get a sample mean as far from that value as we did?
Matched Pairs = One Sample of Differences
Matched pairs often look like two samples, but they aren’t.
Examples:
- Before/after measurements
- Same person under two conditions
- Twins matched on characteristics
Treat this as:
- Compute a difference for each pair.
- Let = true mean difference.
- Run a one-sample t-test on the differences.
⚠️ Define the subtraction clearly (e.g., after − before). If you switch the order, the sign changes and so does the direction of your alternative hypothesis.
When to Use It (and When Not To)
You’ll usually see wording like:
- “Is there convincing evidence…”
- “Do the data suggest…”
Those phrases signal a significance test.
If:
- Data are quantitative
- You’re testing a claim about a mean
- is unknown
→ Use a one-sample t-test.
If the data are categorical (like proportions), this is the wrong procedure. That’s a different test.
Hypotheses for a Population Mean
Always define your parameter in context.
Regular One-Sample t-Test
Let = true mean ___ (in context).
Alternative depends on the question:
- (two-sided)
- (right-tailed)
- (left-tailed)
Key reminders:
- The null always has equality.
- The alternative comes from the wording, not your sample result.
- Never write hypotheses using . Use .
Matched Pairs Hypotheses
Let = true mean difference (state subtraction order).
The value 0 represents “no difference.”
On free-response questions, students often lose points by forgetting to define or in context. Write it out clearly.
Conditions for Inference
Before calculating anything, check Random, Independent, Normal (RIN).
1. Random
Data come from:
- A random sample, or
- A randomized experiment
Say this using the wording from the problem.
2. Independent
If sampling without replacement, check the 10% condition:
In context, you might say:
It is reasonable to believe there are at least 10n students in the population.
3. Normal (Shape)
We need the sampling distribution of to be approximately normal.
You can justify this if:
- (Central Limit Theorem), or
- Population is stated to be approximately normal, or
- If , the sample data show no strong skewness or outliers.
For matched pairs, check normality of the differences, not the original variables.
Strong skewness means the distribution has a long tail to the right or left, like the skewed-left and skewed-right histograms below.
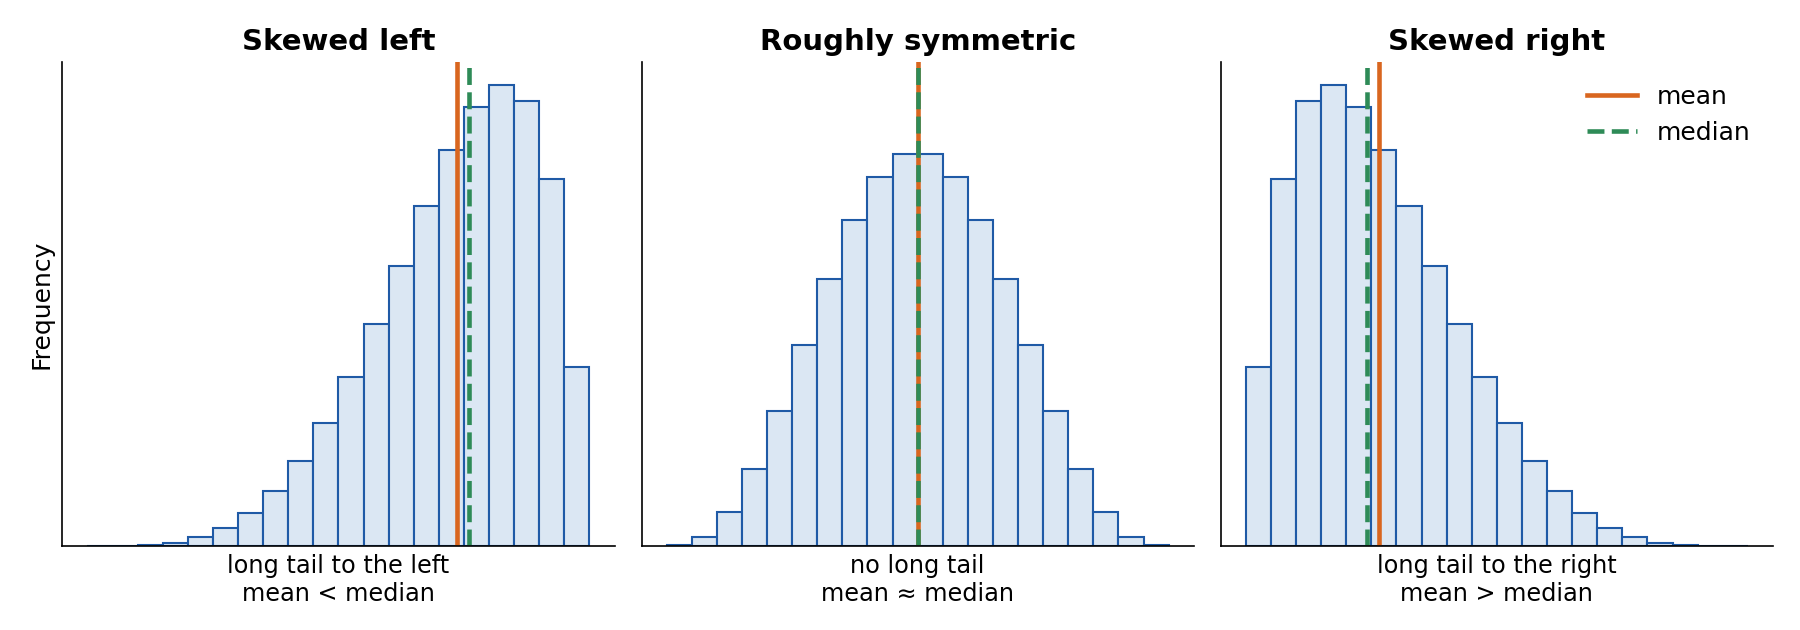
Skewed left, roughly symmetric and skewed right, with the mean and median marked
If your sample is small and looks like one of the skewed shapes, the t-procedure is questionable.
Test Statistic and Significance Level
The test statistic measures how many standard errors the sample mean is from the hypothesized mean.
Degrees of freedom:
For matched pairs, replace with and with .
Significance Level
- = probability of a Type I error
- Commonly 0.05
- Reject if p-value <
In a two-sided test with , the 0.05 is split evenly between the two tails of the t-distribution.
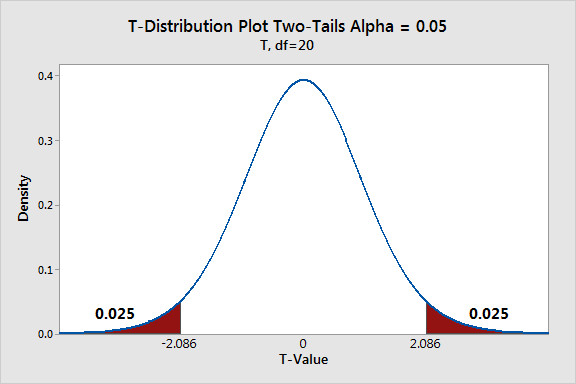
Two-tailed t-distribution with (df = 20)
Each tail has area 0.025. Values beyond the critical t-scores fall in the rejection region.
Connection to confidence intervals:
A two-sided test at matches a 95% confidence interval.
If is outside the interval → reject .
Key Takeaways
One-Sample t-Test for a Population Mean
Tests whether a population mean differs from a hypothesized value when σ is unknown.
Matched Pairs t-Test Setup
Treat paired data as one sample of differences, then test the mean difference.
Null and Alternative Hypotheses for a Mean
H0: μ = μ0; Ha: μ < μ0, μ > μ0, or μ ≠ μ0.
Hypotheses for Matched Pairs
Use H0: μd = 0 or stated value and Ha about μd after defining differences.
Order of Subtraction in Matched Pairs
Define differences consistently, such as before minus after, so μd has clear meaning.
Significance Level
The probability of rejecting a true null hypothesis; denoted by α.
Conditions for a One-Sample t-Test
Check randomization, independence with the 10% condition, and an approximately normal distribution.
Notes
One-Sample t-Test for a Population Mean
Tests whether a population mean differs from a hypothesized value when σ is unknown.
Matched Pairs t-Test Setup
Treat paired data as one sample of differences, then test the mean difference.
Null and Alternative Hypotheses for a Mean
H0: μ = μ0; Ha: μ < μ0, μ > μ0, or μ ≠ μ0.
Hypotheses for Matched Pairs
Use H0: μd = 0 or stated value and Ha about μd after defining differences.
Order of Subtraction in Matched Pairs
Define differences consistently, such as before minus after, so μd has clear meaning.
Significance Level
The probability of rejecting a true null hypothesis; denoted by α.
Conditions for a One-Sample t-Test
Check randomization, independence with the 10% condition, and an approximately normal distribution.
