Topic 9.2 Notes – Confidence Intervals for the Slope of a Regression Model
1. What the slope of a regression model represents
In the population, the true linear relationship is written as
- is the mean response at a given value of .
- is the population slope.
Interpretation of :
For each 1-unit increase in , the mean value of changes by units.
From a sample, we compute the least-squares line:
- is the sample slope.
- is a point estimate of .
How variability enters
Not every point falls exactly on the line. The difference between an observed value and its predicted value is a residual:
These residuals estimate how far actual responses vary from the true population line.
The standard deviation of the residuals estimates the true variability around the regression line:
We divide by because we estimated two parameters, and .
Important sampling facts:
- The sampling distribution of has mean .
- Its standard deviation depends on:
- residual variability (how scattered points are vertically),
- spread of the -values,
- sample size.
Because we don’t know the population standard deviation , we use a t‑interval for the slope.
2. Conditions for a confidence interval for the slope
All four must be checked and stated in context.
Linear
The relationship between and is linear.
Check the residual plot. You want random scatter around 0.
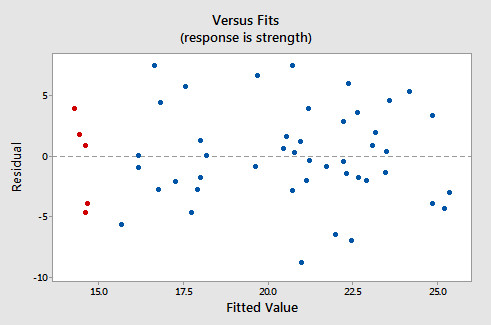
Residual plot showing random scatter around 0
Equal spread
The variability of is roughly constant for all .
On the same residual plot, look for no funnel or fan shape as fitted values increase.
Independence
- Data come from a random sample or randomized experiment.
- If sampling without replacement, verify .
Normal
For each value of , the distribution of is approximately normal.
Check a histogram or normal probability plot of residuals.
If residuals are skewed, you need for the t‑procedure to be reliable.
3. Constructing the confidence interval for the slope
This is a t-interval for .
Formula
Where:
- Point estimate:
- Degrees of freedom:
- Margin of error:
The standard error of the slope is
- = standard deviation of residuals
- = sample standard deviation of the -values
What affects the margin of error?
The margin of error equals .
It gets larger when:
- confidence level increases (bigger ),
- residual variability is large,
- spread in (small ) is small,
- sample size is small.
It shrinks with:
- larger ,
- less vertical scatter,
- wider spread of -values.
On your calculator, LinRegTInt will compute this directly using your data lists.
4. Interpreting the interval correctly
A complete interpretation always includes:
- confidence level,
- the population parameter ,
- the variables in context,
- “mean” language.
Example structure:
“We are 95% confident that the true slope describing the relationship between [explanatory variable] and the mean [response variable] is between ___ and ___.”
Then explain meaning:
“For each 1-unit increase in [x], the mean [y] changes by between ___ and ___ units.”
What the confidence level means:
If we repeated this sampling process many times, about of the intervals would capture the true .
The parameter is fixed. The interval changes from sample to sample.
5. Common mistakes
- Using instead of .
- Using df = instead of .
- Interpreting the interval as predicting individual -values.
- Saying there is a probability that is in this interval.
- Forgetting to check residual plots before computing.
Remember, this interval estimates the population slope, not the intercept and not individual outcomes.
Key Takeaways
Residual
The observed y-value minus the predicted y-value from the sample regression line.
Confidence Interval for the Slope
An interval, b ± t*SEb, that likely captures the true population slope β.
Population Slope, Sample Slope, and Sampling Distribution of b
The sample slope b estimates β, and across many samples b is centered at β.
Margin of Error and Standard Error for Slope
The margin of error is t*SEb, where SEb = s/(sx√(n−1)).
Standard Deviation of the Residuals
It estimates σ by √[Σ(y−ŷ)²/(n−2)] because two regression parameters are estimated.
Conditions for a Confidence Interval for Slope
Check linearity, constant variance, independence, and approximately normal responses for each x-value.
Degrees of Freedom for Slope Inference
Use n−2 degrees of freedom because both the intercept and slope are estimated.
Notes
Residual
The observed y-value minus the predicted y-value from the sample regression line.
Confidence Interval for the Slope
An interval, b ± t*SEb, that likely captures the true population slope β.
Population Slope, Sample Slope, and Sampling Distribution of b
The sample slope b estimates β, and across many samples b is centered at β.
Margin of Error and Standard Error for Slope
The margin of error is t*SEb, where SEb = s/(sx√(n−1)).
Standard Deviation of the Residuals
It estimates σ by √[Σ(y−ŷ)²/(n−2)] because two regression parameters are estimated.
Conditions for a Confidence Interval for Slope
Check linearity, constant variance, independence, and approximately normal responses for each x-value.
Degrees of Freedom for Slope Inference
Use n−2 degrees of freedom because both the intercept and slope are estimated.
