Topic 8.5 Notes – Setting Up a Chi-Square Test for Homogeneity or Independence
1. Chi-Square Tests for Homogeneity and Independence
Both tests analyze a two-way table of counts (not percentages) for categorical variables.
Here’s the kind of table we’re talking about:
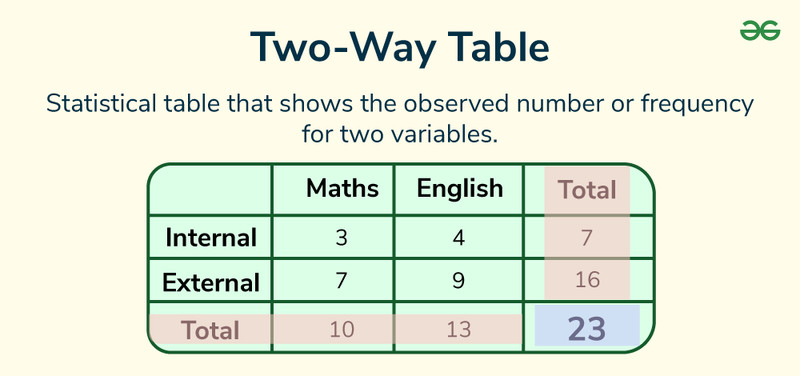
Example of a two-way table with row totals, column totals, and a grand total
Each cell shows an observed count for a combination of two categories. The margins show row totals, column totals, and the overall total.
At the heart of both tests is this idea:
- If the null hypothesis is true, we can calculate expected counts for each cell.
- We compare Observed (O) vs Expected (E).
- Big differences → big test statistic → small p-value → evidence against .
Both tests use the same statistic:
and the same chi-square distribution, which:
- Is right-skewed
- Has values ≥ 0
- Uses degrees of freedom
So the math is the same. The difference is how the data were collected and how you phrase the hypotheses.
2. Choosing the Right Test
The question to ask yourself is: How was the data collected?
a. Chi-Square Test for Independence
Use this when:
- You take one random sample from a single population.
- You record two categorical variables for each individual.
- You want to know if those variables are associated in the population.
Think: One population, two variables.
Example structure:
- Random sample of voters in a city
- Record political party and preferred news source
- Question: Are party and news preference associated?
If it’s one SRS and two variables measured on each person, it’s independence.
b. Chi-Square Test for Homogeneity
Use this when:
- You have two or more independent samples, or
- You have a randomized experiment with different treatment groups.
- You compare the distribution of one categorical variable across groups.
Think: Multiple populations (or treatments), one categorical response.
Example structure:
- Random sample from Company A
- Random sample from Company B
- Record job satisfaction level
- Question: Is the distribution of satisfaction the same at both companies?
Important connection:
- Randomized experiment → homogeneity
Treatments create the groups you’re comparing.
Students often mix these up. The table can look identical. The story behind the data is what decides.
3. Writing the Hypotheses
Your hypotheses must match the test type and be written in context.
a. Independence Hypotheses
: There is no association between the two categorical variables in the population. (They are independent.)
: There is an association between the two categorical variables in the population.
In context example:
: There is no association between political party and preferred news source for voters in this city.
Always nondirectional. Never talk about specific cells.
b. Homogeneity Hypotheses
: The distribution of the categorical variable is the same across populations or treatments.
: The distribution differs across populations or treatments.
In context example:
: The distribution of job satisfaction levels is the same for employees at Company A and Company B.
You are comparing entire distributions, not single proportions.
4. Conditions for Inference
Two things must be verified.
a. Independence Condition
For independence test:
- Data come from a simple random sample.
- If sampling without replacement, check .
For homogeneity test:
- Data come from independent random samples (stratified SRS), or
- Treatments were randomly assigned.
- Also check the 10% condition if sampling without replacement.
On an FRQ, you must explain how randomness was achieved.
b. Large Counts Condition
Chi-square procedures need enough data.
All expected counts ≥ 5.
Expected count formula:
Common mistake: checking observed counts instead of expected counts.
If even one expected count is below 5, the chi-square model may not be appropriate.
Key Takeaways
Chi-Square Test for Independence vs. Homogeneity
Independence uses one sample from one population; homogeneity compares distributions across separate populations or treatments.
Null and Alternative Hypotheses for Chi-Square Test for Independence
H0: two categorical variables are independent; Ha: the variables are associated in the population.
Null and Alternative Hypotheses for Chi-Square Test for Homogeneity
H0: population or treatment distributions are the same; Ha: at least one distribution differs.
Two-Way Table
A table that displays counts for combinations of two categorical variables.
Expected Count
The count predicted for a cell if the null hypothesis is true.
Conditions for Chi-Square Tests for Independence and Homogeneity
Use the proper random process, check n/N ≤ 10% when needed, and ensure all expected counts exceed 5.
Notes
Chi-Square Test for Independence vs. Homogeneity
Independence uses one sample from one population; homogeneity compares distributions across separate populations or treatments.
Null and Alternative Hypotheses for Chi-Square Test for Independence
H0: two categorical variables are independent; Ha: the variables are associated in the population.
Null and Alternative Hypotheses for Chi-Square Test for Homogeneity
H0: population or treatment distributions are the same; Ha: at least one distribution differs.
Two-Way Table
A table that displays counts for combinations of two categorical variables.
Expected Count
The count predicted for a cell if the null hypothesis is true.
Conditions for Chi-Square Tests for Independence and Homogeneity
Use the proper random process, check n/N ≤ 10% when needed, and ensure all expected counts exceed 5.
