Topic 2.1 Notes – Introducing Statistics: Are Variables Related?
What It Means for Two Variables to Be Related
Here we’re looking at bivariate data. That just means we measure two variables on the same individuals.
Example:
- For each student: hours of sleep and quiz score.
- For each voter: political party and opinion on a policy.
The big question is always:
If I know one variable, does that tell me something about the other?
That’s an association.
- If knowing one variable changes what we expect for the other → association.
- If the distribution of one variable looks the same no matter what the other variable is → no association.
Remember from Unit 1 that variation is everywhere. Even if two variables aren’t related, random chance can make small samples look patterned. That uncertainty is the heart of statistics.
Questions that signal this topic:
- Are these variables associated?
- Do the groups differ?
- Is there a trend as one variable increases?
- Could the pattern just be random?
Types of Bivariate Data
Everything depends on what type of variables you have.
1. Two Categorical Variables
Both variables put individuals into categories.
Examples:
- School type (public/private) and participation in sports (yes/no)
- Favorite subject and grade level
We compare conditional proportions.
Instead of asking “How many?”, we ask:
Of this group, what percent fall into each category?
If the conditional percentages are similar across groups → little/no association.
If they’re noticeably different → possible association.
Raw counts can mislead you. If one group is larger, it will naturally have larger counts. Percentages let you compare fairly.
2. Two Quantitative Variables
Both variables are numerical.
Examples:
- Minutes studied and exam score
- Outside temperature and ice cream sales
We use a scatterplot to look for a pattern.
We describe association using four things:
- Direction
- Positive → as x increases, y tends to increase
- Negative → as x increases, y tends to decrease
- Form
- Linear or curved
- Strength
- How tightly points follow a pattern
- Outliers
- Unusual points that don’t fit the trend
Graphs Used to Detect Association
For Two Categorical Variables
A segmented bar graph helps compare conditional percentages. Each bar represents a group, and the segments within a bar show the conditional distribution for that group.
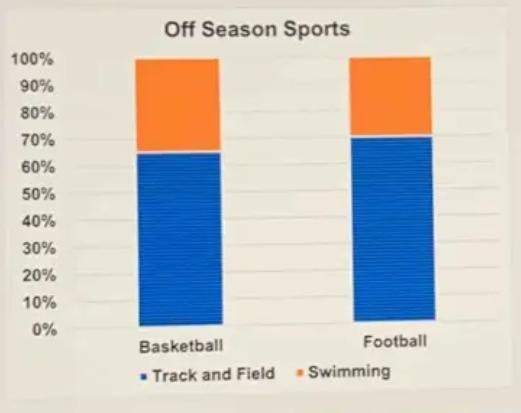
Segmented bar graph comparing conditional percentages
In the example above, each sport has a bar that totals 100%, and the colored segments show the percent in Track and Field and Swimming within that sport.
If the segments line up closely across groups, there’s likely no association.
If the segment sizes differ clearly, that suggests association.
A mosaic plot shows the same idea using area.
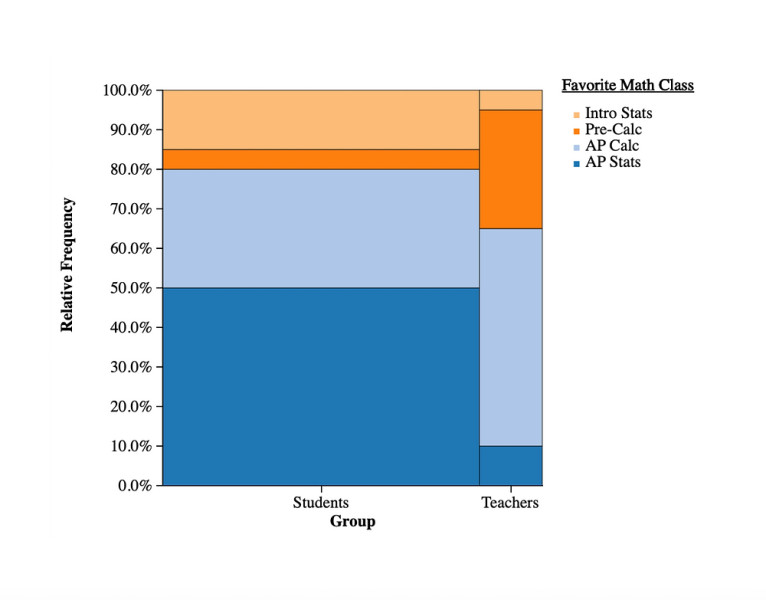
Mosaic plot comparing two categorical variables
Here, the widths of the columns represent the group sizes, and the colored areas show the conditional distribution within each group.
You’re always comparing conditional distributions.
For Two Quantitative Variables
The scatterplot is your main tool.
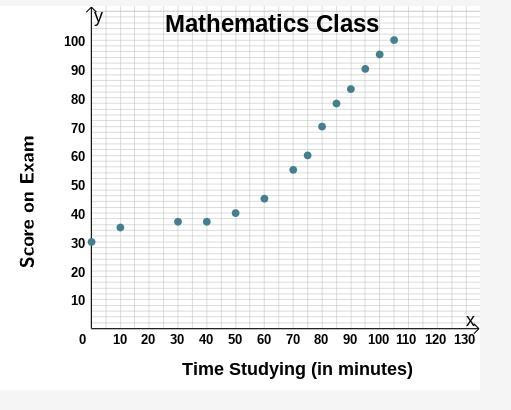
Scatterplot showing positive curved association
In this example, as study time increases, exam scores tend to increase, which indicates a positive association.
When you describe it, be specific:
“There is a strong positive curved association between minutes studied and exam score.”
That kind of wording shows you understand direction, form, and strength.
What Association Does and Does Not Mean
What it means:
- There is a pattern in the sample.
- Knowing one variable helps predict the other.
What it does not mean:
- It does not prove causation.
- It does not guarantee the pattern isn’t due to random variation.
- It does not mean the relationship holds for the whole population without further analysis.
Students lose points by jumping from “associated” to “causes.” Keep those separate.
Identifying the Statistical Question
When you see a scenario, pause and ask:
- What are the two variables?
- Are they categorical or quantitative?
- What graph fits?
- Are we investigating whether there’s an association?
On free-response questions, you may only be asked to identify the relationship type. On multiple choice, they love giving a graph and asking whether the evidence suggests association or could be due to random chance.
Key Takeaways
Categorical and Quantitative Variables
Categorical variables place individuals into groups; quantitative variables record numerical amounts or measurements.
Two-Way Table
A table that displays counts or proportions for combinations of two categorical variables.
Segmented Bar Chart and Mosaic Plot
Graphs for two categorical variables that compare conditional proportions across groups.
Scatterplot
A graph of paired quantitative data points showing one variable on each axis.
Apparent Pattern
A visible trend or structure in data that may reflect a real relationship or random variation.
Random Variation
Natural chance-based differences in data that can create misleading patterns.
Bivariate Data
Data on two variables for each individual, which may be categorical or quantitative.
Association
A relationship between variables that can be positive, negative, or absent.
Conditional Relative Frequency
A proportion describing one variable within a specific category of another variable.
Notes
Categorical and Quantitative Variables
Categorical variables place individuals into groups; quantitative variables record numerical amounts or measurements.
Two-Way Table
A table that displays counts or proportions for combinations of two categorical variables.
Segmented Bar Chart and Mosaic Plot
Graphs for two categorical variables that compare conditional proportions across groups.
Scatterplot
A graph of paired quantitative data points showing one variable on each axis.
Apparent Pattern
A visible trend or structure in data that may reflect a real relationship or random variation.
Random Variation
Natural chance-based differences in data that can create misleading patterns.
Bivariate Data
Data on two variables for each individual, which may be categorical or quantitative.
Association
A relationship between variables that can be positive, negative, or absent.
Conditional Relative Frequency
A proportion describing one variable within a specific category of another variable.
