Topic 2.2 Notes – Representing Two Categorical Variables
Two-Way Tables and Joint Relative Frequencies
When each individual in your data set is classified by two categorical variables, you organize the information in a two-way table (also called a contingency table).
- Rows = categories of one variable
- Columns = categories of the other variable
- Cells = number of individuals in that combination
Here is a sample two-way table for 200 students classified by grade level and whether they play sports:
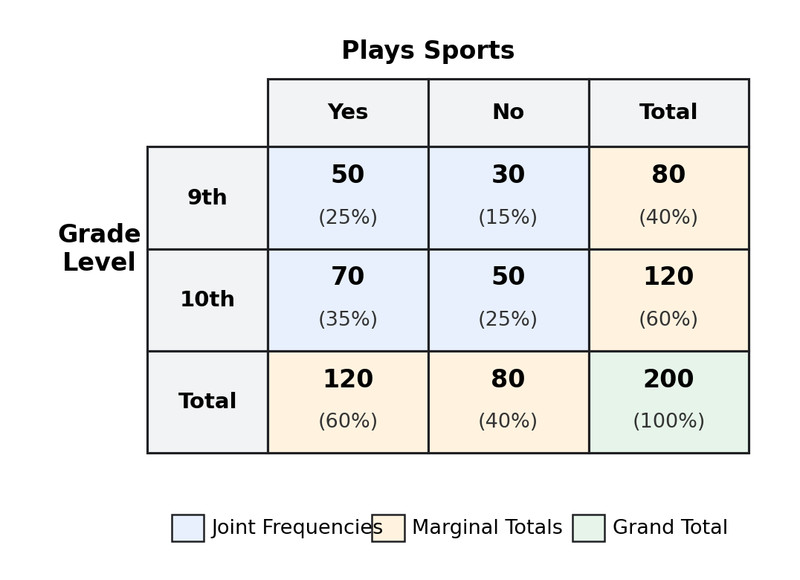
Two-way table of grade level and sports participation
From a table like this, you can identify:
- Joint frequencies = the counts inside the table (ex: 50 ninth graders who play sports).
- Marginal totals = row and column totals (ex: 80 ninth graders total).
- Grand total = total number of individuals (200 here).
Relative Frequencies
Raw counts depend on sample size. Proportions are usually more meaningful.
Joint relative frequency
Using the table above, .
So 25% of all students are ninth graders who play sports.
All joint relative frequencies together add to 1.00.
Marginal relative frequency
If a table is entirely in joint relative frequencies, the bottom-right total is 1.
Conditional Relative Frequencies
This is where the AP questions usually live.
A conditional relative frequency compares categories within a group.
- Row conditional → divide each cell by its row total.
- Column conditional → divide each cell by its column total.
Using the ninth-grade row in the table above:
.
So 62.5% of ninth graders play sports.
Notice what changed. We are no longer dividing by 200. We’re dividing by 80 because we’re restricting attention to ninth graders.
When you’re asked to compare distributions, you almost always use conditional relative frequencies, not counts.
Graphs for Two Categorical Variables
All the graphs below use the same example about grade level and whether students play sports. Each one is a visual version of conditional distributions.
Side-by-Side Bar Graphs
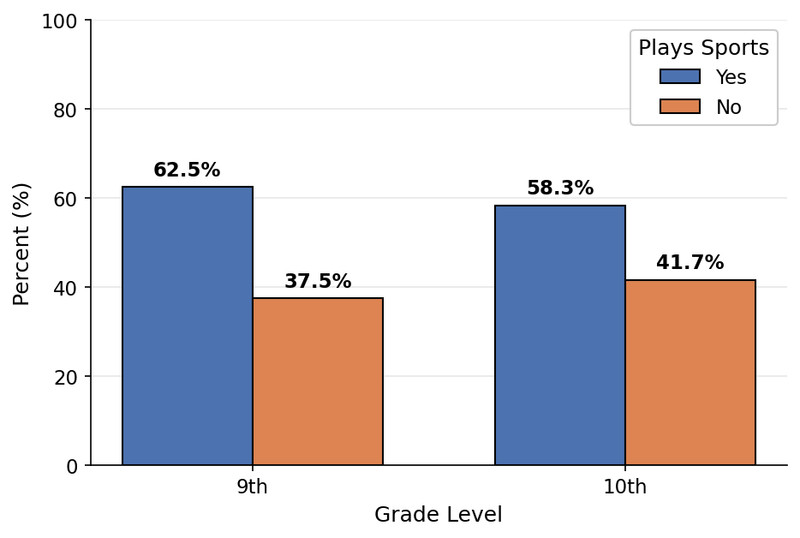
Side-by-side bar graph of conditional percentages
Each grade level has separate bars for “Yes” and “No.”
You compare the heights of corresponding bars across grades.
Great for spotting differences in proportions quickly.
Segmented Bar Graphs
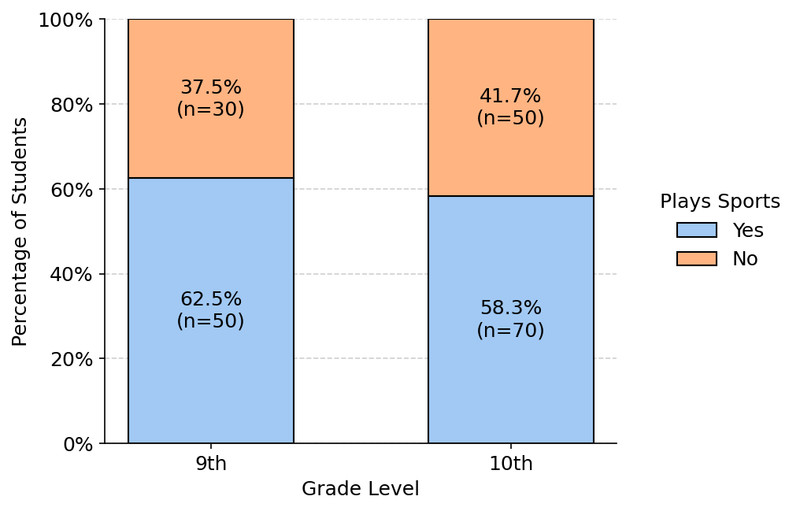
Segmented bar graph with each group totaling 100%
Each bar represents 100% of that grade level.
Segments show the conditional proportions within that grade.
Now you’re comparing how each 100% bar is divided up.
Mosaic Plots
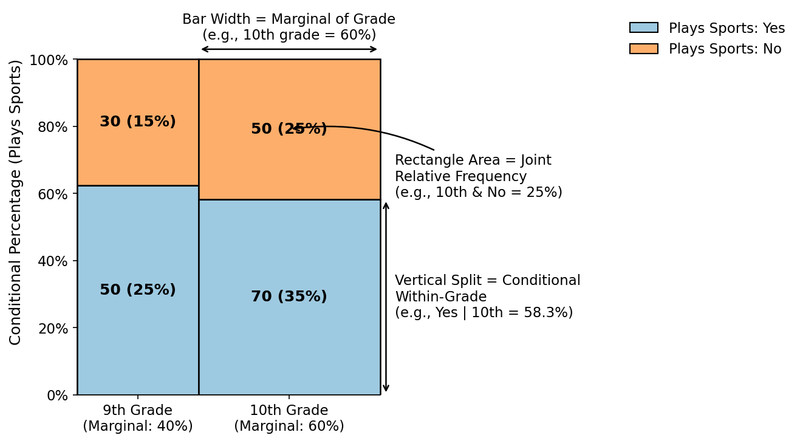
Mosaic plot showing marginal and conditional distributions
A mosaic plot combines everything:
- Width = marginal distribution of one variable
- Height within each section = conditional distribution
- Area of each rectangle = joint relative frequency
Think of it as a picture version of the two-way table.
Determining Whether Variables Are Associated
Two categorical variables are associated if knowing one helps predict the other.
They are independent if the conditional distributions are the same across groups.
Here’s how you decide:
- Choose which variable defines the groups.
- Compare the conditional proportions across those groups.
- Look for meaningful differences.
In the sports example, 62.5% of ninth graders play sports compared to 58.3% of tenth graders. Those percentages are close, so there may not be much association.
On a free-response question, you must:
- Mention both variables
- Compare conditional percentages
- Conclude in context
Example:
“There is little evidence of an association between grade level and playing sports because the percent who play sports is similar for ninth and tenth graders.”
Never say one variable causes the other unless it was a randomized experiment designed to show causation.
Key Takeaways
Two-Way Table / Contingency Table
A table of counts or relative frequencies for all combinations of two categorical variables.
Joint Relative Frequency
A cell count divided by the total number of observations in the entire table.
Frequency Counts vs. Relative Frequencies in a Two-Way Table
Counts show numbers in each cell; relative frequencies show proportions or percents instead.
Side-by-Side Bar Graph
Bars for one categorical variable are grouped by categories of a second variable for comparison.
Segmented Bar Graph
Each bar represents one group and is divided into segments showing category proportions within that group.
Mosaic Plot
A graph of rectangles whose areas represent joint relative frequencies for two categorical variables.
Association vs. No Association
Variables are associated if conditional distributions differ across groups and not associated if they match.
Comparing Distributions and Detecting Association
Compare conditional proportions across groups to judge whether two categorical variables are associated.
Conditional Relative Frequency
A proportion within one row or column showing a category's share of that group.
Notes
Two-Way Table / Contingency Table
A table of counts or relative frequencies for all combinations of two categorical variables.
Joint Relative Frequency
A cell count divided by the total number of observations in the entire table.
Frequency Counts vs. Relative Frequencies in a Two-Way Table
Counts show numbers in each cell; relative frequencies show proportions or percents instead.
Side-by-Side Bar Graph
Bars for one categorical variable are grouped by categories of a second variable for comparison.
Segmented Bar Graph
Each bar represents one group and is divided into segments showing category proportions within that group.
Mosaic Plot
A graph of rectangles whose areas represent joint relative frequencies for two categorical variables.
Association vs. No Association
Variables are associated if conditional distributions differ across groups and not associated if they match.
Comparing Distributions and Detecting Association
Compare conditional proportions across groups to judge whether two categorical variables are associated.
Conditional Relative Frequency
A proportion within one row or column showing a category's share of that group.
